On 17 July, the commission presented its long-awaited proposal for reform of the EU’s Emissions Trading System (ETS).
It recommended a number of changes, including giving companies free allowances to cover their emissions for longer than previously planned, conditional on climate investment plans.
The proposal offers a more business-friendly and “savvy” approach, argued EU climate commissioner Wopke Hoekstra in a press conference.
But critics believe it could “weaken” the system and put EU climate targets at risk.
Alongside the proposal, the commission also announced a new target for electricity to make up 46% of energy consumption by 2040, doubling the current rate of 23%.
This could cut EU spending on imported fossil fuels by €260bn annually, according to the commission.
In this Q&A, Carbon Brief outlines the details of the new ETS proposal – which is subject to negotiation with member states – and explores what it could mean for climate action.
The EU ETS is a carbon market, which puts a price on the greenhouse gas emissions of companies in power generation, industry, aviation and other sectors.
It covers everything from electricity generation to steel production, as well as flights within the EU and a handful of other European countries.
Emissions in these sectors have halved since the ETS launched in 2005, according to the European Commission.
A European parliament briefing describes the system as a “cornerstone” of EU climate policy, covering around 40% of the bloc’s overall emissions.
It applies to emissions in all 27 EU countries alongside Iceland, Liechtenstein, Norway and electricity generation in Northern Ireland. (The UK established its own ETS after Brexit.)
The ETS operates as a “cap and trade” system, which puts a limit on the amount of carbon dioxide equivalent (CO2e) that can be emitted within the sectors it covers.
The “cap” on emissions gradually decreases each year until, eventually, they are expected to reach zero.
The currency of trade within the system is “allowances”. One allowance is equal to one tonne of CO2-equivalent emissions.
At present, around 57% of these allowances are bought by companies in auctions. The EU generated around €43bn in revenue from these auctions in 2025.
The remaining 43% of allowances are given to companies for free, to cover some or all of their emissions.
This is intended to prevent “carbon leakage” – the idea that companies operating in countries with strict climate policies will relocate to countries with looser rules.
The amount of free allowances varies by sector, depending on factors including the level of competition with overseas firms that do not face a carbon price.
Countries and companies have been divided on how they wanted the ETS to evolve.
Some pushed for more ambition to help meet European climate goals. Others called for it to be rolled back, amid rising costs for businesses.
In March, 10 countries including Italy, Hungary and Poland wrote a letter to the commission calling the ETS an “existential risk” for key industrial sectors, reported Euronews.
Italy had earlier even called for the system to be suspended outright.
France and other countries favoured introducing a slower descent towards bringing the emissions cap to zero by 2039.
Some steel and chemical companies also criticised the cost burden of the ETS.
Other organisations focused on calls for stability and predictability in the system.
In recent weeks, Spain, the Netherlands and five other countries called on the commission to “resist gutting” the ETS in its review, said E&E News. They said the ETS should be strengthened to “ensure long-term investment predictability and regulatory stability”.
Weakening the system could “undermine investment signals and leave Europe more exposed to fossil-fuel shocks”, said a March 2026 briefing from climate thinktank E3G.
Another E3G briefing said the “risk” is that politicians weaken the system as a short-term economic fix, “undermining one of the EU’s main tools for delivering on its industrial transformation ambitions”.
Dozens of investment organisations called on EU countries to facilitate a “robust and predictable” ETS. They said that “policy stability is the cheapest investment stimulus available to the EU”.
In its list of priorities for ETS reform, the NGO Carbon Market Watch said that “now is not the time to backslide” on its aims and terms.
The commission’s proposal outlines a number of changes to the ETS, to bring it in line with the EU’s climate goal to cut emissions to 90% below 1990 levels by 2040.
The review will “bring relief to industry”, the commission says, while also continuing the ETS’ “essential” role in climate action.
However, others are more sceptical about the impacts it could have on climate action.
Below, Carbon Brief details the main aspects of the proposal.
The European Commission proposes to extend free allowances beyond a previously agreed date.
Free allocations were due to reduce from this year and be fully removed by 2034.
However, the commission has proposed to extend this to 2038, on the condition that companies receiving free allowances set out how they will invest in decarbonising their EU operations.
It proposes that from 2031 onwards, 80% of free allowances in the system would be given to companies that have submitted plans for investment in EU decarbonisation.
The remaining 20% of free allowances would only be allocated to those that can prove they followed through with planned investments and achieved the emissions reductions they had previously outlined.
This move is a “step in the right direction”, says Dr Kirsten Scholl, the director for EU affairs at thinktank Epico, but it must not “impose excessive administrative burdens”.
The EU’s carbon border adjustment mechanism (CBAM) was designed to replace the existing system of free allowances in the ETS.
It is a tax applied to certain imported goods, based on the amount of CO2 emissions released during their production. It began to be phased in at the start of 2026.
As a result, free allocation is being gradually phased out from 2026-38.
However, the commission has proposed that 15% of free allocations due to be removed because of CBAM should be reintroduced from 2028, to “reduce the speed at which CBAM is phased-in and mitigate the remaining carbon leakage risk”.
The commission says that preventing carbon leakage “remains a crucial element” of the ETS.
Pushing back the phase-out of free allowances and the full implementation of CBAM “risks squandering the EU’s credibility with investors and trading partners alike”, says Francesco Lombardi Stocchetti, a policy advisor on sustainable economy at the Bellona Foundation, an environmental NGO.
“Europe cannot lead the clean industrial transition just by moving the goalposts,” he adds in a statement.
The commission has proposed to cut emissions in the ETS more slowly from 2031 onwards.
This could mean new allowances are able to enter the scheme into the 2040s, instead of ending in 2039 as previously planned.
But the planned changes are still “aligned” with the EU’s 2040 climate target and net-zero requirement by 2050, says the commission.
The overall ETS cap on emissions was reduced by 1.7% each year up to 2020 and then by 2.2% annually since 2021.
It is then agreed to drop by 4.3% over 2024-27 and 4.4% from 2028 onwards.
Maintaining similar rates after 2030 would not be “realistic”, says the commission’s proposal.
Instead, it suggests that the cap should fall by 3.7% per year over 2031-35 and by just 1.7% annually over 2036-40.
This will make the path to zero emissions within the ETS “more gradual and aligned with domestic climate ambition level”, claims the commission.
But WWF says that the proposal would allow an extra 2bn tonnes of CO2e to be emitted. (See: What could the changes mean for greenhouse gas emissions?)
The commission has proposed plans to incorporate more airline emissions into the ETS.
The plan outlines that, from 2029, all flights departing from the European Economic Area (EU, Iceland, Liechtenstein and Norway) and landing in other countries within 5,000km of a point in central Europe should be added to the ETS.
This distance means that the changes would not apply to flights landing in China or the US. (Both the US and China have opposed the expansion of ETS coverage for flights.)
The commission also proposes including emissions from private jets and other “business flights” in the ETS.
It notes that aviation currently accounts for 14% of EU transport emissions. This is expected to skyrocket to around 90% by 2050, given it is more difficult to decarbonise than other modes of transport.
Some aviation emissions have been included in the ETS since 2012. This included emissions from air travel within the EEA and flights departing from Switzerland and the UK.
The airline industry did not respond favourably to reports of plans to expand beyond this scope.
On 8 June, the biggest airlines in Europe urged commission president Ursula von der Leyen not to extend the ETS to cover international flights, saying that it would raise ticket prices.
A study commissioned by Carbon Market Watch found that the ETS encompassing all flights departing from the EEA, not just those within it, would result in a “very small impact on ticket prices and passenger demand”.
Under the proposed changes, EU countries would need to funnel half of the money they receive from ETS auctions towards decarbonising sectors covered by the system.
This would amount to more than €100bn in investment for decarbonisation before 2030, says the commission.
Around three-quarters of the money generated by the ETS has been allocated to EU countries since 2013, the proposal notes.
Since 2023, countries have been required to spend all of this money on climate and energy-related activities – at least on paper.
But the proposal says the “transparency and effectiveness” of this mechanism has been “insufficient”.
Currently, only around 5% of the ETS money “directly supports industrial decarbonisation in sectors such as steel, chemicals and fertilisers”, it adds.
Going forward, the proposal says that 50% should be put towards actions aiding clean-energy plans, industrial decarbonisation and improved waste management, as some examples.
A briefing by thinktank Institut Montaigne noted that the money generated within the system for EU countries to help finance the energy transition should be “at the heart” of ETS discussions, amid budget constraints in many EU countries at the moment.
The commission has proposed integrating permanent carbon removals into the ETS to “give additional flexibility” for certain sectors that struggle to decarbonise. This action was previously agreed within the terms of the EU’s 2040 climate target.
“Permanent” removals refer to direct air capture with carbon storage and similar measures, rather than temporary removals such as planting trees.
The removals would be integrated into the system by increasing the allowance cap by an amount equivalent to the number of removals purchased.
This will set up “additional emission space” for hard-to-abate sectors and also support the “scale-up of the carbon removals industry”, outlines the proposal.
It also proposes that certain companies, such as shipping and aircraft operators, could compensate for their emissions with their own certified carbon removals.
These emissions would not be permitted to “go beyond zero”, adds the proposal.
Sven Harmeling, the head of climate at Climate Action Network (CAN) Europe, says that adding carbon removals “would weaken the ETS impact, undermine the carbon price and create new loopholes for polluters instead of accelerating the transition away from fossil fuels”.
The proposal “fails to ensure that only high-integrity removal technologies would be considered”, he adds in a statement.
However, the director of the Potsdam Institute for Climate Impact Research, Prof Ottmar Edenhofer, describes the move as “an important step”, saying:
“For the first time, it creates a credible and long-term investment framework for carbon-removal technologies in Europe.”
The commission proposes that firms covered by the ETS could make use of “high-integrity” credits bought on the global carbon market from 2036 onwards.
This relates to the EU’s 2040 climate target, in which up to 5% of the 90% reduction in GHGs can come from global carbon credits.
Amélie Laurent, a policy advisor in carbon accounting at the Bellona Foundation, says in a statement that these credits “should be in a strategic last resort reserve, not an excuse to avoid doing our homework”.
Aurora D’Aprile, the EU policy director at the International Emissions Trading Association, notes in a statement:
“For international credits, early preparation on governance and procurement and greater certainty around a pilot from 2031, will be essential to establish a credible demand signal.”
The commission has outlined plans to expand the inclusion of the maritime sector in the ETS.
Maritime accounts for around 4% of the EU’s total emissions. The new proposals for the sector include adding certain small ships of 400-5,000 tonnes to the system.
The proposal also outlines plans to incorporate more waste incineration into the ETS on a gradual basis from 2031.
Since 2024, some waste-burning companies have been required to monitor and report their emissions under the ETS. But they did not have to purchase credits.
Now, the commission proposes introducing the sector on a gradual basis.
Under the proposals, companies would require allowances for 25% of their emissions in 2031, 50% in 2032, 75% in 2033 and 100% from 2034 onwards.
The market stability reserve was added to the ETS in 2019 to help stabilise the flow of allowances.
It acts like an overflow container holding extra allowances. If the number of allowances in the market falls below a certain threshold, more are brought out from the reserve to balance things out.
Equally, if the market is flooded with too many allowances, depressing prices, then some are removed and put into the reserve.
The commission has proposed a reform of the reserve, including changing the upper and lower limits for when allowances are released or removed.
It wants to reduce the rate at which allowances are withdrawn from auctions when they exceed a certain threshold from 24% to 12% from 2028.
This means that the permits would be able to stay in the market for longer.
As shown in the chart below, the price of carbon in the EU increased tenfold over 2017-2021, exceeding €80 (£68) per tonne of CO2.
Nevertheless, the commission proposal says the reserve was “effective in mitigating price shocks” on the ETS caused by the Covid-19 pandemic and the surge in energy prices after Russia invaded Ukraine in 2021.
The EU and UK have agreed in principle to link their carbon markets, but the commission’s proposal says negotiations are still “under progress”.
It adds that the commission “foresees” future financial contributions from the UK to the EU’s ETS, if a final agreement is reached.
Many companies have called for the systems to be linked. In June, dozens of carbon-capture organisations and industry groups signed a letter calling for greater certainty on EU-UK links to ensure cross-border carbon-capture and storage projects are covered, for example.
Switzerland’s ETS has been linked to the EU since 2020.
The European Commission says the ETS plays a “crucial role” in meeting its climate targets “cost-effectively”.
The system contributed to a 41% reduction in EU industrial emissions over 2021-23, a decrease of around 800m tonnes of CO2 per year, according to recent analysis from the London School of Economics.
As highlighted in the chart below, the EU’s overall GHG emissions have dropped by 40% since 1990.
Climate commissioner Hoekstra told a press briefing that the proposal is “fully aligned” with the EU’s target to cut GHGs to 90% below 1990 levels by 2040. He called the plan “completely climate-law proof”.
He also noted that no other EU policy has contributed to reducing emissions on the scale of the ETS, describing it as a “phenomenal asset”.
But campaigners and experts are concerned that the proposed changes could slow decarbonisation and put the EU’s climate goals at risk.
Carbon Market Watch says the plans would “severely weaken” the ETS and “risk undermining the achievement of the EU’s 2040 and 2050 climate targets”.
The proposals “would represent a major setback for EU climate ambition, weakening incentives to cut emissions, extending reliance on fossil fuels and putting the 2040 climate target at risk”, says a statement from WWF.
WWF estimates that 2bn extra tonnes of CO2 would be emitted if the proposals were approved in the EU.
Michael Bloss, a German member of the European parliament (MEP) for the European Greens, says the plans would release around 1.4bn tonnes of extra CO2. He describes the proposal as “climate vandalism”.
Chiara Martinelli, the director of CAN Europe, says:
“Every extra tonne of CO2 allowed under the ETS makes Europe’s climate challenge harder and more expensive. Weakening the ETS now is a gift to polluters that have prioritised shareholder payouts instead of investing in cleaner production.”
The European Commission’s new ETS proposal has been met with a mixed response.
Scholl from Epico says the proposal has “important flexibilities that can help address competitiveness challenges and provide greater certainty for industrial investment”. But she adds in a statement:
“Concerns remain about whether the proposed changes preserve the long-term investment signal of the ETS and sufficiently recognise companies that have already committed to ambitious decarbonisation pathways.”
Edenhofer from the Potsdam Institute for Climate Impact Research adds that the proposals provide “clarity on the contribution that emissions trading is intended to make towards the 2040 climate target”.
Elisa Giannelli, a programme lead at E3G, says in a statement:
“Today’s proposal might please some, but it risks increasing both the long-term cost and the time needed to deliver the EU’s growth strategy.”
Pepe Escrig, a senior researcher, also at E3G, adds that the commission held onto some of the ETS’ “essential foundation”, but “yielded to political pressure to weaken it as a quick fix to broader challenges”.
This has left the plan “pull[ing] in two directions: strengthening support for industrial investment while weakening parts of the framework meant to drive it”, says Escrig.
Andrea Spignoli, the policy manager of sustainable markets at Bellona Europa, says the proposal risks “weakening green investments” and putting a larger decarbonisation burden onto other sectors that are not covered by the ETS.
Greg Van Elsen, a senior industrial policy coordinator at CAN Europe, says in a statement:
“Free pollution permits were never meant to become a permanent subsidy. Extending them until 2038 rewards delay instead of industrial decarbonisation.”
Lobby groups also had mixed reactions to different aspects of the proposal.
The International Air Transport Association says it is “deeply frustrated” with the proposal.
The organisation’s director general, Willie Walsh, claims the consequences will be “harmful”, “sowing acrimony over extraterritoriality, slowing global decarbonisation and sapping European competitiveness”.
WindEurope says the proposal risks “slowing decarbonisation and failing to channel billions in ETS revenues to industrial electrification”.
BusinessEurope’s director general, Markus J Beyrer, says some aspects “raise concerns”. For example, he says the “new conditionalities for free allocations risk increasing bureaucratic complexity and the uncertain role for international carbon credits”.
ETS2 is a separate emissions trading system to the main ETS. It is due to take effect in 2028 and is not affected by the current ETS review or resultant proposals.
It will operate under a similar system as the existing ETS, covering emissions from transport, buildings and smaller industries in other sectors.
One key difference, however, is that ETS2 will not provide any allowances for free. They will all be auctioned and bought by companies.
On 15 July, 10 countries, including Italy and Poland, had urged the commission to also reconsider the ETS2 during this review. They were unsuccessful.
Similar to the original ETS, the commission believes the carbon price under the new ETS2 system will “provide a market incentive for investments in building renovations and low-emissions mobility”.
However, in June, member-state governments and the European parliament agreed on a number of “safeguards” to support price stability.
For example, if allowance costs under the ETS2 exceed €45 per tonne of CO2, they agreed that 40m allowances will be put into the system from a reserve to normalise the supply – double the amount previously agreed.
A European Environment Agency briefing said the ETS2 will “affect fuel prices and mobility costs” and that money will be syphoned into a social climate fund to “support vulnerable households and investments”.
EU countries will now negotiate over the terms of the commission’s proposal before it goes to a vote in the European parliament.
Ireland, which recently took over the six-monthly rotating presidency of the Council of the EU, has stated that it wants the ETS proposals to be signed off by the end of this year.
A previous document from the council, which represents member-state governments, outlined a target to agree a deal by the first quarter of 2027.
Clean Energy Wire says that this would be an “unusually ambitious timetable for one of the bloc’s most technically complex pieces of climate legislation”.
Politico notes that “months of arguing” is likely to occur.
‘FIREWAVE’: Wildfires ravaged Europe and North America this week. France utilised water-dumping planes collecting from the Seine to contain a fire in the Fontainebleau forest near Paris, according to the Associated Press. The Financial Times reported that the UK has had “25 non-consecutive days with temperatures of 30C or more, including nine days above 34C”, creating a “firewave” and putting pressure on emergency services. Meanwhile, an “orange haze from Canada wildfires” could be “seen in Ontario and northern US”, said BBC News.
‘NEW NORMAL’: Climate events previously seen as extreme are becoming the “new ‘normal’”, said the Met Office, in a report on the UK’s climate. While last year was the UK’s hottest on record, rising temperatures mean it is expected to be surpassed in the next few years, reported Reuters. Liz Bentley, head of the Royal Meteorological Society, told the Guardian that “climate change has been described by scientists for many years but is now increasingly being felt by the UK population in their own homes and communities”.
The drop in Brazilian Amazon deforestation in the first half of 2026, compared to last year, reported Al Jazeera.
(For more, see Carbon Brief’s in-depth daily summaries of the top climate news stories on Monday, Tuesday, Wednesday, Thursday and Friday.)
Carbon Brief explained how more than 1,000 heat-related deaths in England and Wales during May and June were attributed to climate change, accounting for almost half of all heat-related deaths experienced during those months. The article also unpacked the different methods for estimating heat deaths around the world.
This week, Carbon Brief interviews Meaghan Macdonald, senior project and programme manager for London’s Natural History Museum, about their first permanent climate-themed exhibition, Fixing Our Broken Planet.
Carbon Brief: Why are programmes such as Fixing Our Broken Planet so important?
Meaghan Macdonald: One of the main things we’re trying to achieve with Fixing Our Broken Planet is to place the museum as a convener of conversations around the planetary emergency…trying to bring together the different groups of people who need to be involved in this conversation in order to work together to find a solution.
And we find that a lot of the people who come into the gallery weren’t necessarily coming here to see it; they come across it, which is a really great way to engage people who may not have been engaged in that discussion previously.
CB: How does the exhibition engage and inspire visitors?
MM: A driving force for this exhibition is that you are dealing with a subject matter that can be quite disheartening, and one of the things that we were very careful about is to try to make sure that woven throughout the scientific data… is a sense of hope… to enable people to feel empowered to make a difference.
We were able to do things like our “what you can do” labels, which give an example that people can take away with them. We also have “conversation starters”, which is a digital screen that asks people a series of questions related to the planetary emergency. Things like: “Should we mine the deep sea to power the green economy?”…And there’s no right or wrong answer.
We [also] set out very specifically to…forefront the science that’s happening here. We know from multiple studies from thinktanks and organisations that people actually trust our scientists the most.
CB: The museum has set out a goal to “create advocates for the planet”. What does this mean? How does it relate to the exhibition and the museum’s wider climate action?
MM: The aim of the museum is to get to a place where both people and the planet thrive. Being a library of the natural world, it is our duty to be standing up for it and to help people find their way, fighting for nature’s side.
In order to create those advocates, the aim of the [exhibition] and the wider advocacy programmes at the museum is to try to find ways to bring all these people [individuals, policymakers, industry, scientists] together.
We have the wider programme with Fixing Our Broken Planet. We have Generation Hope…a free graphic panel version of our display in the gallery that we have been able to get into a number of venues in Bangalore…the very long-standing and beloved wildlife photographer of the year [exhibition]…our urban nature movement…[and] an initiative that we are doing with the Department for Education called the National Education Nature Park.
STUBBORN HOPE: For the Conversation, climate scientist Prof Peter Stott argued that researchers need to “talk more about the very worst-case scenarios” and the possibility for action.
EXTREME: Vox’s the Gray Area podcast spoke to New York Times journalist David Wallace-Wells about the possibility of a “Godzilla” El Niño.
RESPONSIBILITY: For Climate Home News, two researchers from the Center for International Environmental Law explored how “major emitting countries knew of climate risks decades earlier than claimed”.
DeBriefed is edited by Daisy Dunne. Please send any tips or feedback to debriefed@carbonbrief.org.
This is an online version of Carbon Brief’s weekly DeBriefed email newsletter. Subscribe for free here.
In France, the national public health agency reported 2,025 excess deaths over the week where the heatwave peaked in June.
Authorities in Germany and Netherlands put the excess death toll during the same seven-day period at 5,753 and 533, respectively.
An analysis from climate scientists in Carbon Brief found that France saw more than 2,700 heat-related deaths over 17 days in June.
Separate research estimated there had been 2,700 heat-related deaths in the UK’s May and June heatwaves – 42% of which had been caused by human-caused climate change.
There are a number of methods for how academics and governments tally deaths caused by extreme heat, each with their own advantages and drawbacks.
Here, Carbon Brief looks at the different ways scientists and public health authorities have calculated the death toll of Europe’s record-breaking summer heat.
Economists and epidemiologists have been studying the relationship between heat and mortality for nearly a century.
A pioneering study published in 1923 by geographer Ellsworth Huntington and economist Margaret Justin that looked at mortality data for New York City over 1882-88 found that deaths increased rapidly as temperatures rose above 17C.
As global temperatures have risen in response to human-caused carbon emissions, scientists have increasingly sought to understand how warming could impact mortality.
The study of mortality caused by specific heatwave events dates back a few decades, with a 1995 heatwave in Chicago among the earliest events to be studied in detail.
Over the past decade, a growing number of studies have gone a step further, by estimating the number of deaths caused by a specific heatwave event and then attributing a percentage or number of those deaths to human-caused climate change.
Carbon Brief covered the first study of this type, which was published in Environmental Research Letters in 2016 and focused on a 2003 summer heatwave that caused tens of thousands of deaths across Europe.
The study estimated that 506 of the 735 summer fatalities in Paris and 64 of the 315 in London were a result of human influence on the climate.
More recently, a study in Climatic Change found that 27% of deaths in a 2018 heatwave in Zurich, Switzerland were linked to human-caused climate change and a paper in Science Advances estimated that 11-15% of deaths in a 2021 heatwave in British Columbia were attributable to global warming.
Dr Christopher Callahan, assistant professor at the O’Neill School of Public and Environmental Affairs at Indiana University, tells Carbon Brief this type of “two-step” study has “really exploded” in recent years:
“It is really only in the last five to 10 years that we have seen this, partly because it does require interdisciplinary expertise. You need people who know how to run the epidemiological models and you need a climate analysis of the counterfactual [world] without climate change, which is its own effort.”
A central challenge in estimating deaths from a heatwave is that heat is rarely recorded as the primary cause of death on death certificates.
However, exposure to high temperatures has wide-ranging effects on the human body, including the strain of keeping cool. This effort places pressure on the heart and kidneys.
As a result, heat extremes can worsen health risks from chronic conditions and cause acute kidney injury. Researchers have linked heat to increased mortality from respiratory and cardiovascular diseases, as well as dementia and Alzheimer’s.
As a result, public health authorities and scientists cannot depend on death certificates for a full count of heat-related deaths. They instead estimate heat deaths using a number of different approaches, each with assumptions baked into their calculations.
Dr Garyfallos Konstantinoudis, who researches methods for calculating excess mortality due to extreme events at the Grantham Institute for Climate Change and the Environment at Imperial College, tells Carbon Brief there is “no ground truth” when it comes to tallying heat-related deaths:
“We don’t know what the heat-related deaths are, so we rely on different models to describe the picture.”
This makes the study of deaths from heatwaves similar to those from air pollution, he says:
“This sort of health-impact assessment has been done for years on studies related to deaths from air pollution, which have the same problem. Air pollution, until very recently, was not recorded on death certificates.
“[However], for air pollution, the [scientific] literature is much larger, so no one questions that air pollution is toxic and kills. This sort of messaging for heat is more recent.”
There are, broadly speaking, two approaches to calculating deaths during a heatwave.
The first involves counting the number of excess deaths relative to a period in the past.
This method – often referred to as an “excess deaths” approach – looks at how many people died during a particular time period compared to a baseline period where there was no heatwave.
To do this, public health authorities and researchers rely on official death figures reported by country authorities.
The heat death tolls published in recent weeks by public health agencies in Belgium, France, Germany and the Netherlands relied on this approach.
(For more, see: What are the pros and cons of the ‘excess deaths’ method?)
The second method uses long-term mortality data to understand the statistical relationship between temperature and mortality in a given place. The model that emerges can be used to infer the number of deaths from a heatwave in that place.
In a rapid analysis published this week, researchers at Imperial College London, the London School of Hygiene and Tropical Medicine (LSHTM) and the Met Office used this approach to estimate that the May and June heatwaves in the UK caused the deaths of 2,700 people.
Dr Callahan – working with Prof Andrew Dessler, director of the Texas Center for Extreme Weather at Texas A&M University – used this method to estimate that more than 2,700 people had died in France over a 17-day period in June in an analysis for Carbon Brief.
(For more: see: What are the pros and cons of the ‘statistical modelling’ method?)
The majority of the figures released in the wake of Europe’s June heatwave have relied on these two methods.
There is a third way to calculate heat deaths, which is to look at official counts of deaths attributed on death certificates to heatstroke.
Callahan tells Carbon Brief that the “death-certificate coding” appears to have fallen out of favour in Europe – which he says is a “smart move” given that it does not provide a “full accounting”.
Nevertheless, some public health authorities are still using this method. For example, in the wake of the heatwave in the US earlier this month, public health data showed 29 people in New Jersey and three people in New York had died from “heat-related illnesses”.
Scientists tell Carbon Brief the excess deaths and statistical modelling approaches both have advantages and drawbacks. These are explored below.
The table below shows the death numbers that have been reported by governments and researchers for Europe’s May and June heatwaves, including the approach used to reach the figures.
It suggests that multiple countries in Europe experienced more than 1,000 heat-related deaths during the late June heatwave, with authorities in Germany counting more than 5,000.
Meanwhile, the EuroMoMo mortality monitoring system estimated there were more than 10,500 excess deaths across 27 countries during the June heatwave.
| Reported | Source | Country / region | Dates | Days | Deaths | Link | Approach |
|---|---|---|---|---|---|---|---|
| 28/06/2026 | Public Health France | France | 22-27 June | 6 | 1,000 | santepubliquefrance.fr | Excess deaths |
| 29/06/2026 | World Health Organization | Europe | 21-28 June | 8 | 1,300 | x.com/DrTedros/status | Excess deaths |
| 01/07/2026 | Carlos III Health Institute (MoMo) | Spain | 1-30 June | 30 | 1,033 | dw.com | Excess deaths (all-cause and temperature-attributable) |
| 02/07/2026 | National Institute for Public Health and the Environment | Netherlands | 22-28 June | 7 | 480 | rivm.nl | Excess deaths |
| 03/07/2026 | Public Health France | France | 22-28 June | 7 | 2,025 | santepubliquefrance.fr | Excess deaths |
| 07/07/2026 | Chris Callahan/Andrew Dessler | France | 12-29 June | 18 | 2,766 | carbonbrief.org | Statistical modelling |
| 08/07/2026 | Chris Callahan | Europe | 15-28 June | 14 | 13,975 | zenodo.org | Statistical modelling |
| 08/07/2026 | Sciensano | Belgium | 18 June - 1 July | 14 | 1,747 | brusselstimes.com | Excess deaths |
| 09/07/2026 | Robert Koch Institute | Germany | 22-28 June | 7 | 5,120 | rki.de | Statistical modelling |
| 13/07/2026 | Met Office/LSHTM/Imperial | England and Wales | 22-27 June | 6 | 2,183 | drive.google.com | Statistical modelling |
| 13/07/2026 | Met Office/LSHTM/Imperial | England and Wales | 24-26 May | 3 | 553 | drive.google.com | Statistical modelling |
| 13/07/2026 | EURO Mo/Mo | 27 European countries | 22-28 June | 7 | 10,650 | reuters.com | Excess deaths |
| 07/07/2025 | National Institute for Public Health and the Environment | Netherlands | 22-28 June | 7 | 577 | archive.ph | Excess deaths |
| 14/07/2026 | Germany Federal Statistical Office (Destatis) | Germany | 22-28 June | 7 | 5,753 | destatis.de | Excess deaths |
In most instances, Carbon Brief has linked to the figures published by public health authorities, where numbers were first reported. In some instances, figures were released on dashboards or webpages that are updated weekly. In these cases, Carbon Brief has linked to media reports or archived web content.
The excess deaths approach looks at how many more people died during a particular time period compared to a baseline period of the same length.
For instance, on 14 July, Germany’s federal statistics agency, Destatis, published figures showing Germany saw 32% more deaths than the average in the week of 22-28 June, which was dominated by the heatwave.
Specifically, the agency said that 23,932 deaths had been recorded that week, compared to an average of 18,179 in that calendar week across the years 2022-25.
This suggests there were 5,753 excess deaths during the heatwave week. (This was a slight increase from preliminary Destatis figures released a week earlier, covered by Bloomberg.)
The Netherlands similarly calculates excess deaths by comparing death figures against an average of deaths in a similar period during unspecified “previous years”.
Data published by the country’s National Institute for Public Health and the Environment (RIVM) shows that, during the week of 22-28 June, an estimated 3,626 people died in total in the northern European country.
This is 577 more deaths than the 3,049 expected at that time of year, it said. (This is a slight revision upwards from the 480 excess deaths reported on 4 July by NL Times based on preliminary figures from NVIM.)
Callahan says that the excess deaths approach has the benefit of being rapid and relatively uncomplicated:
“It is something that public health authorities can put out fairly quickly without having to run a fancy model and do coding like the academic scientists do. It is a short-term, high-impact, rapid estimate of mortality.”
The drawback to the approach is that it is impossible to decipher what percentage of these “all-mortality” excess deaths are, in fact, heat-related.
Imperial College’s Konstantinoudis notes that the public often “feels more comfortable” with the excess deaths approach over the statistical modelling approach because the data it is using – the official death numbers – is based on real-world data.
However, he stresses that excess deaths figures are based on a series of assumptions, including the reference period picked by researchers and how the numbers are interpreted.
Statisticians and researchers have to make a series of decisions, including what period to use as a comparative baseline. For example, the baseline period could be the week before a heatwave, the same week a year before – or an average of the same week across multiple years in the past. If averaging mortality of a similar period across a number of previous years, they must decide how much “weight”, or influence, each year should have.
They must also decide how to account for spikes in deaths during the Covid-19 pandemic years, as well as the gradual rise in average temperatures due to global warming.
During the pandemic, many governments and the World Health Organization (WHO) used the excess deaths approach to count deaths. The WHO said this metric was more “comparable” and “objective” than relying on national reports of Covid-19 deaths, given that different countries used different criteria for this classification.
A notable example of how assumptions can skew excess death figures came during this period, when the WHO estimated in 2022 that Germany had seen 195,000 excess deaths over two years of pandemic.
However, after statisticians and epidemiologists pointed out the assumptions in the model were not suited to Germany’s demographics, the WHO retracted the figure and eventually reduced it to 122,000 and then later to 102,000.
Konstantinoudis explains:
“Covid taught us that it is complicated. Depending on the different assumptions used in the excess-mortality approach, you get different results…There is a scientific basis, but we should acknowledge the assumptions.”
In the statistical modelling approach, researchers use models to determine the specific relationship between mortality and temperature for a particular location and then apply it to temperatures observed during a heatwave.
This allows them to estimate the overall number of deaths that were caused by a heatwave.
Previous research has revealed that, in most places of the world, there is a U-shaped response of mortality to temperature – where deaths increase rapidly in cold or hot conditions as daily maximum temperatures depart further from an “optimum temperature”.
For example, research published in Proceedings of the National Academy of Sciences in 2025 found that mortality rates in France rise as daily maximum temperatures move away from approximately 20C. This is shown in the chart below.
Indiana University’s Callahan say this approach allows scientists to “formally establish a relationship between the temperature and the mortality”, adding:
“If you do these calculations right, you can credibly say your entire estimate of mortality is heat-related.”
Prof Antonio Gasparrini, biostatistician and epidemiologist at LSHTM, explains the method relies on “timeseries models that apply relatively sophisticated statistical methods in which you ‘smooth’ trends occurring in time, so you control for long-term trends and seasonality”.
He says that these models also allow researchers to “remove” trends affecting mortality that are unrelated to heat – for instance, the impacts of the pandemic. They can also “add” other information, such as around how air pollution combines with heat to threaten vulnerable populations.
Gasparrini adds:
“What statistical modelling can bring is that it is more refined. It can link specific temperatures to specific impacts rather than just looking at the event [in the whole]. And also, it can be localised – [data] can be stratified at a fine scale and we can look at impacts at different scales.
“So, it is more informative. But, at the same time, of course, it’s based on more assumptions than the [excess deaths approach] and, of course, needs to be checked and compared.”
The approach depends on a number of judgment calls from scientists and statisticians, including the years picked to underpin the model and how to capture the lag in deaths in the days and weeks after a heatwave event.
They must also decide at what threshold to start counting deaths – in other words, whether to count all deaths above the “optimum temperature” or set a higher, more extreme value – and whether and how to account for any adaptation to heat extremes that may have been put in place in the study area.
A benefit of the statistical modelling approach is that it opens the door for being able to attribute a specific number of deaths to human-caused climate change.
By applying the temperature-mortality curve to both the temperatures of the recent heatwave and a counterfactual world without climate change, scientists can estimate what proportion of estimated deaths only occurred because the world is warming.
For instance, Imperial College, LSHTM and Met Office researchers found that 59% and 38% of heat-related deaths in the UK’s May and June heatwaves, respectively, could be attributed to climate change. Their findings are shown in the chart below.
Some climate-sceptic commentators have argued that modelled estimates are hypotheses and should therefore be treated with caution.
On 13 July, climate-sceptic news website GB News covered a blog post by Oxford academics that argued the figure that 2,700 people had died in the UK’s May and June heatwaves was not reflected in the provisional “all-mortality” data put out by the UK’s Office for National Statistics (ONS). Quoting the blog, GB News said:
“Modelling tells us nothing. Models explore possibilities; surveillance tells us what happened. When the two disagree, our instinct should be to investigate the data rather than simply trust the model.”
However, Imperial’s Konstantinoudis – who worked on the models behind the 2,700 figure – says it is important to await the UK Health and Security Agency (UKHSA)’s annual heat mortality report before arriving at any conclusions. He explains:
“While we are entirely clear that our current findings are modelled estimates, this methodology has consistently delivered comparable results to the UKHSA’s own official analyses of observed deaths for past heat events.”
(The UKHSA report will include updated figures and estimate excess deaths from heat based on specific periods of heat in different regions, whereas the provisional ONS figures cover all national deaths during a full-week period.)
Konstantinoudis says both the excess deaths and statistical modelling approaches have been the subject of extensive peer-reviewed scientific study and can provide a “holistic view of what is happening” when used together.
Studies that have compared statistical modelling approaches for estimating heatwave deaths with excess death figures in the UK have found they yield broadly similar results.
Together, these initiatives would have made up around half of the £200m that the UK pledged to support conservation in the Congo basin – the world’s second-largest rainforest.
When it hosted COP26 in Glasgow, the UK led a new initiative to end forest loss, which included a collective pledge by 12 donors of “at least” $1.5bn (£1.1bn) for Congo rainforest nations by 2025.
Development minister Jenny Chapman revealed last week that, as of 2024, the UK had only provided £39.8m towards this goal.
Alongside the US and much of Europe, the UK has significantly cut its aid budget in recent years, leading to much of its Congo rainforest spending being cancelled or reappraised.
The government says it still plans to “prioritise” rainforest regions, including the Congo basin, but civil society groups and MPs are concerned about the lack of “ring-fenced” forest funding in the UK’s new aid strategy.
At COP26, the UK – led by then prime minister Boris Johnson – launched the “Glasgow leaders’ declaration”, with a goal to “halt and reverse forest loss” by 2030. This was backed by more than 140 nations.
The UK also made various funding pledges, including £200m to protect the Congo basin, £350m for tropical forests in Indonesia and “up to £300m” for the Amazon.
These commitments target the world’s three largest rainforests, all of which face major forest loss due to threats such as agriculture, logging and climate change.
The Congo basin is the planet’s largest forested carbon sink. Yet, its six host nations are among the poorest in the world and face significant funding barriers.
This has global ramifications. An official UK assessment warned that “degradation or collapse” of the Amazon or Congo rainforests “threaten UK national security and prosperity”.
Following successive aid cuts introduced by both the Conservative and then Labour governments – tracking a global trend – the UK’s Congo funding is under threat.
The Congo basin forest action programme (CBFA) was launched by the UK at COP27. It was explicitly set up to provide “roughly half” of the UK’s £200m Congo pledge.
CBFA set out to “empower central African nations”, such as the Democratic Republic of the Congo (DRC), with support for “community forests” and other measures to curb forest loss.
Now, after reporting delays, the UK has slashed the CBFA as part of the Labour government’s recent aid cuts, intended to free up money for defence spending.
Its original £90m budget has now been reduced to £18.8m. Government data shows that £15m of this has already been spent.
This is not the only Congo project that has been dropped due to this latest round of aid cuts.
The Congo part of the biodiverse landscapes fund – championed by the previous government and worth at least £12.3m – has been closed, just two years into its seven-year schedule.
Government documents reveal more Congo forest funding is at risk as the UK scales back its aid budget, including the UK’s two largest remaining projects in the region.
One initiative, intended to “incubate forest-friendly enterprises” in DRC, faces “reduc[ed] budgets”. Officials working on the other, while more optimistic, reported that the project may be forced to operate in fewer countries as the cuts set in.
Documents also reveal the difficulties that come when operating in the Congo, including “complex political economies” and, in Gabon, a military coup – which “complicated matters”.
Damian Fleming, a senior director of forests at WWF International tells Carbon Brief:
“Tropical forest countries are making long-term policy and development choices in expectation that international partners will honour their commitments.”
In a series of recent parliamentary responses, Chapman revealed that the UK had only spent £39.8m on Congo forest finance, as of 2024. (She declined to provide any information on the Indonesia and Amazon regional goals.)
Despite being presented as the UK’s “contribution” to the £1.1bn-by-2025 global goal agreed at COP26, the £200m target has a deadline of 2029.
Therefore, while the collective goal has been met, the UK’s contribution so far has been relatively small.
Zac Goldsmith, a former Conservative minister who oversaw the forest targets at COP26, tells Carbon Brief that, in his view, the UK has “discarded” its regional pledges:
“We have gone from being perhaps the leader on protecting nature internationally to breaking promises to countries around the world for whom the environment is an existential issue.”
The Labour government says it has met the five-year “climate finance” target of £11.6bn that expires this year.
Ministers also say the government has met “and exceeded” the £3bn and £1.5bn sub-goals for “preserving nature” and forests, respectively, within the £11.6bn. These are the funding streams that include support for the Congo basin and other rainforests.
The UK has funded a variety of projects in line with its forest goals, including mangrove restoration in Indonesia, support for carbon-offsetting projects in Brazil and promoting “forest stewardship” among farmers in Cameroon.
Chapman has stated that the UK will continue to “prioritise” the Congo rainforest, in line with its new plan for aid spending in Africa. The UK even helped to launch a new “call to action” for Congo basin funding at COP30 last year.
The UK government also says it supported the creation of Brazil’s flagship “Tropical Forest Forever Facility” (TFFF). However, so far it has not provided any funding for the facility.
When the government announced a new climate finance pledge for 2026 onwards, it stressed that nature would still be a “focus” and said it would also generate billions in “climate and nature positive investments”. Nevertheless, it dropped the “ring-fenced” amounts for nature and forests that had appeared in its previous pledge.
The UK, alongside other developed countries, has pledged to provide biodiversity finance to developing countries, under the Kunming-Montreal Global Biodiversity Framework (GBF) – a non-binding global pact to halt and reverse nature loss by 2030.
Sarah Champion, chair of the international development committee of MPs, says “sub-pledges” for nature and forests are a “cost-effective and impactful” way to ensure this finance is provided, alongside climate finance. She tells Carbon Brief that she was “concerned” about the move away from this approach:
“When the minister recently appeared before the international development committee, I was concerned to hear her characterise this shift as a ‘gamble’.”
A government spokesperson tells Carbon Brief:
“We remain committed to providing finance for forests, including in the Congo basin, as a core element of our overall climate funding.”
A shorter version of this article was first published in Cropped, Carbon Brief’s fortnightly newsletter that provides a digest of food, land and nature news, on 15 July 2026. Subscribe for free.
This is an online version of Carbon Brief’s fortnightly Cropped email newsletter.
Subscribe for free here.
DRY THEN WET: A recent heatwave and months of low rainfall has led to a prolonged drought for Uganda, resulting in at least 16 deaths from hunger and significant crop losses, reported BBC News. Bastille Post Global suggested that “a developing El Niño later this year could bring heavier rainfall to parts of the region, raising the risk of flooding in areas now struggling with drought”.
FUNDING FOOD: The UN Food and Agriculture Organization (FAO) and the World Food Programme (WFP) have appealed for $200m in funding to help African nations deal with the impact of El Niño, stated Deutsche Welle. This would target 22 high-risk countries with measures, including “cash transfers, climate-resilient seeds, livestock protection and flood control.” The Guardian explained how El Niño could still “cause a severe shock to global food prices lasting into 2028”.
FARMING FEARS: Extreme weather has devastated agriculture across the world. India saw its driest June in 12 years, reported BBC News, and France has had a “double-digit production” decline, according to Le Monde. The Financial Times reported that farmers in the UK are mitigating the impacts of extreme heat by eliminating “chemicals and intensive ploughing to improve soil quality so it retains water”.
EURO FIRES: Wildfires have spread across Europe, with Spain reporting at least 12 deaths so far, according to the Guardian, and France experiencing road closures, said Reuters. Wildfire Today reported that the most extreme conditions are “across France, Spain and northern Portugal, the Alpine arc extending into northern Italy, the south of the UK and south-east Ireland”. CNN explained how “the climate crisis is driving hotter, drier weather, which is setting the stage for fiercer fire seasons”.
REDEFINING HARM: The Trump administration “reversed decades of longstanding environmental law protecting endangered species…opening up sensitive habitats…to drilling, mining, farming and real estate development”, reported CNN. According to the story, the change “redefines what constitutes ‘harm’” to endangered species, which historically prohibited habitat modification or degradation. Agence France-Presse reported that US environmental groups sued the Trump government over the move, arguing that it had violated “common sense, biological science and federal law”.
OPEN SEASON: Reuters reported that the change “limits the reach of the 50-year-old Endangered Species Act” (ESA), which is a “key regulatory consideration” when granting permits for “oil and gas, mining, electric transmission and other operations on federal lands and water”. Legal scholars told the New York Times the US government “was acting without conducting scientific research into the impact” of the change, while the National Mining Association “applauded the announcement”.
Amid worldwide cuts to aid spending, Carbon Brief explores how the UK is backtracking on funding for the Congo basin – the world’s second-largest rainforest.
The UK has abandoned projects worth tens of millions of pounds that were meant to help protect Congo rainforests and support local people.
Together, these initiatives would have made up half of the £200m that the UK pledged to support forest conservation in the Congo basin.
When it hosted COP26 in Glasgow, the UK led a new initiative to end forest loss, which included a collective pledge of “at least” $1.5bn (£1.1bn) for Congo rainforest nations by 2025.
Development minister Jenny Chapman revealed last week that, as of 2024, the UK had only provided £39.8m towards this goal.
At COP26, the UK – led by then prime minister Boris Johnson – launched the “Glasgow leaders’ declaration”, with a goal to “halt and reverse forest loss” by 2030.
The UK also made various regional funding pledges, including £200m for the Congo basin, £350m for tropical forests in Indonesia and “up to £300m” for the Amazon.
All of these rainforests face major forest loss. The Congo basin is the planet’s largest forested carbon sink, but its six host nations are among the poorest in the world and face significant funding barriers.
This has global ramifications. An official UK assessment warned that “degradation or collapse” of the Amazon or Congo rainforests “threaten UK national security and prosperity”.
Following successive aid cuts introduced by both Conservative and Labour governments – tracking a global trend – the UK’s Congo funding is under threat.
The Congo basin forest action programme (CBFA) was explicitly set up to provide “roughly half” of the UK’s £200m Congo pledge.
Now, after reporting delays, the UK has slashed the CBFA as part of the Labour government’s aid cuts. Its £90m budget has been “quietly reduced by 79% to £18.8m”, according to the Times.
This is not the only Congo project that has been dropped due to aid cuts. The Congo part of the biodiverse landscapes fund – worth at least £12.3m – has closed five years early.
Official documents reveal more Congo forest funding is at risk, including the UK’s two largest remaining projects in the region. One initiative, intended to “incubate forest-friendly enterprises” in DRC, faces “reduc[ed] budgets”.
Documents also show the difficulties operating in the Congo, including “complex political economies” and, in Gabon, a military coup – which “complicated matters”.
Damian Fleming, a senior forests director at WWF International told Carbon Brief:
“Tropical forest countries are making long-term policy and development choices in expectation that international partners will honour their commitments.”
In a parliamentary response, Chapman said that the UK had spent £39.8m towards its £200m Congo target, as of 2024.
Despite being described as the UK’s contribution to the £1.1bn-by-2025 global goal agreed at COP26, the £200m target has a deadline of 2029. Therefore, while the collective goal has been met, the UK’s contribution was relatively small.
Zac Goldsmith, a former Conservative minister who oversaw the forest targets at COP26, told Carbon Brief that, in his view, the UK has “discarded” its regional pledges:
“We have gone from being perhaps the leader on protecting nature internationally to breaking promises to countries around the world.”
The Labour government says it has met its overarching “climate finance” goals and still intends to “prioritise” the Congo rainforest.
However, civil society groups and MPs are concerned about the lack of “ring-fenced” forest funding in the UK’s new aid strategy.
TOXIC TROUBLES: DeSmog unpacked a new report that said Northern Ireland is being turned into a “toxic” pig and poultry farming “sacrifice zone” to satiate the UK’s meat appetite.
NEED TO NOAA: Laid-off scientists from the US’s National Oceanic and Atmospheric Administration (NOAA) launched Climate.Us – an independent, public-backed version of the climate information website shut down by Trump last year.
DRY FRUIT: A Dialogue Earth long read looked at how climate change is impacting apricot harvests in the “stark, high-altitude desert” region of Ladakh, India.
READING ALOUD: A London Review of Books podcast discussed Robin Wall Kimmerer’s influential book “Braiding Sweetgrass”, weighing its compelling themes and where it veers into “scientific overreach”.
This edition of Cropped was written by Jess Milligan, Josh Gabbatiss and Aruna Chandrasekhar. Cropped is edited by Dr Giuliana Viglione. This edition was edited by Daisy Dunne. Please send tips and feedback to cropped@carbonbrief.org.
When asked his views on allowing new North Sea drilling in June – a move that the oil-and-gas industry and right-wing media have pushed for in recent months – he said he had “something of an open mind” on the issue.
But a trawl of Burnham’s past comments about climate change, net-zero and fossil fuels reveals a different picture.
Just a year ago in June 2025, Burnham, while mayor of Greater Manchester, gave his support to the fossil fuel treaty – a proposed international pact on phasing out coal, oil and gas – calling it a “lifeline” that “all governments” should join.
In a video message endorsing the treaty, he also said that “there should be no turning away from net-zero”.
During his last bid to be Labour leader in 2015, he used similar language, saying:
“Labour under my leadership will never turn our back on either our duty to tackle climate change or the prospects offered by the green economy.”
Burnham has spoken about the threat of climate change since at least 2008, noting in 2021 that accelerated action could “create thousands of good jobs”, but also warning that net-zero risked becoming the “next Brexit”.
Burnham is yet to appoint his cabinet, but there is much speculation that he will select current net-zero secretary Ed Miliband as his chancellor – with their ally Miatta Fahnbulleh having a “strong chance” of taking Miliband’s former position.
Below, Carbon Brief recounts 28 things that Burnham has said about climate change, net-zero, fossil fuels, energy and transport.
“Tackling climate change isn’t just about protecting the planet – it’s a powerful opportunity to build a fairer, greener future for our communities and businesses.”
Calling for local councils to be given more power and money for climate action, 29 November 2025
“There is little doubt that Greater Manchester’s biodiversity has taken a hit over the years, with habitats being lost, destroyed and becoming less diverse due to the impact of development, climate change, pollution and invasive species…We are committed to delivering a city-region for all residents to enjoy – a fairer, greener and more prosperous place for everyone.”
Statement after Greater Manchester declared a “biodiversity emergency”, 25 March 2022
“Over the next decade, if we accelerate our response to the climate crisis, we can create thousands of good jobs, improve homes, overhaul our transport system and make [Manchester] an even better place to live.”
Greater Manchester Green Summit, 18 October 2021
“The environment has never been higher on the national and international agenda.”
Statement after visiting a peat bog restoration project in England, 9 January 2020
“I think climate change [action] will be driven more quickly from the bottom up, if I’m honest. It’s the will of evolution if you wait for the government to act…When governments aren’t listening you get out and get your voice heard…so I think [climate protesters] deserve our encouragement, not our criticism.”
Speaking to Manchester Evening News at a student climate protest in Manchester, 24 May 2019
“Labour under my leadership will never turn our back on either our duty to tackle climate change or the prospects offered by the green economy.”
Labour leadership candidate speech, 15 July 2015
“Climate change can seem a distant, impersonal threat – in fact the associated costs to health are a very real and present danger…We need well-designed climate change policies that drive health benefits.”
Speaking to the Guardian about a study on climate and health, 25 November 2009
“The Stern report on the economics of climate change has changed the debate, in this country and around the world. It made it clear that the people who could suffer most from a failure to tackle climate change, or from a lack of ambition in our approach to it, are those living in the developing countries. They are the most vulnerable…[and] Stern said that the cost of not acting would be large. That is why the government took various measures in the recent spending review to ensure that we are prepared to face the challenges posed by climate change.”
Speaking in the UK parliament on the economic impacts of climate change on his final day as chief secretary to the Treasury, 24 January 2008
“There should be no turning away from net-zero.”
Speaking after giving his support to the fossil fuel treaty – a proposed global pact to introduce laws to phase out coal, oil and gas – on behalf of Manchester, 6 June 2025
“An opportunity is opening up for Britain as other countries move away from net-zero. We should seize that…We can make Britain a green leader. This is not the time to tiptoe, it is the time to commit to this path.”
Speaking at Innovation Zero World Congress in London, 29 April 2025
“[We] need a government that fully buys into the 2038 vision because the UK will not get to 2050 unless places like Greater Manchester are freed up to go faster – and we’re ready to go faster.”
Speaking about Greater Manchester’s aim to reach net-zero by 2038, 19 October 2022
“In Greater Manchester we have plans to build 30,000 net-zero social rented homes because we recognise that a successful city region needs good quality, affordable accommodation for everyone.”
Speech on the future of cities, 24 June 2022
“By building a broad consensus behind the drive to net-zero, we can ensure that the transition is a fair one that delivers social justice as well as climate justice. This is an opportunity for all of us to show how cutting carbon emissions in our cities can make a real difference to our communities – away from the abstractions and rooted in the real world.”
Panel discussion in Glasgow during the COP26 climate summit, 12 November 2021
“To the extent that people have picked up anything from COP26, it’s a sense that the drive to net-zero will mean cost and inconvenience for ordinary people and offsetting for the wealthy and entitled. All of a sudden, you can feel how net-zero could become the new Brexit – a debate that gets very divided on class grounds…This has got to be a wake-up call. We cannot let this happen. We need to act now to build a broad social consensus behind the drive to net-zero. How to do that? It starts with taking control of the climate narrative from those steering it in the wrong direction and turning it around…We must show how, if done in the right way, the drive to net-zero is actually an opportunity to reduce the cost of living; to make people’s lives better and society fairer.”
Writing for the London Standard, 5 November 2021
“The drive to net-zero is a chance to re-industrialise the north of England, this time in a clean way. Create really good jobs, future-facing jobs for people, better public transport, improve people’s homes…If we go quickly towards net-zero, it’s the quickest way to level up the country.”
ITV interview at COP26, 1 November 2021
“If we really embrace the drive to net-zero, that is the route to level up the country…But it needs substantial investment, upfront, now, of the kind that Rachel Reeves, shadow chancellor [and chancellor under Keir Starmer’s government], has been talking about. We need long-term predictable funding.”
Interview with GB News at COP26, 1 November 2021
“I would have preferred to hear slightly less about carbonated wine and much more about a decarbonised economy.”
Referencing a UK budget, which included tax cuts for sparkling wine and other drinks, 28 October 2021
“Decarbonising is not just about lowering costs on to people. It’s the route to get better, cheaper public transport. It’s the route to getting homes that are cheap to run. It’s actually the way we can create thousands of good jobs for the people who live in Greater Manchester. This is the route to levelling up the country by going further and faster on decarbonisation.”
Speaking to Manchester Confidential, 20 October 2021
“[I am] asking people to stop seeing the environmental agenda as a cost and a burden agenda. I think this is a barrier that we’ve got to get over. Already in the media interviews I’ve done today, people are saying ‘can you afford it?’, ‘can it be achievable when times are tough?’.
“My answer to that is, at some point in the 21st century, all homes will be zero-carbon. At some point in this century, all buildings of any kind will be zero-carbon…All cars will be zero-carbon, all public transport will be zero-carbon…The question is: when? And surely the places that embrace those things first are putting themselves in a position of economic strength when it comes to facing up to the future. Rather than seeing the whole agenda as a burden, we’ve got to see it for the benefits that it can bring.
“There may be a greater upfront cost in a zero-carbon home, but let’s stop thinking, as we tend to do in Britain, of the short-term, the short-termist approach to life. Surely let’s start talking to the public about the lifetime cost.”
Greater Manchester Green Summit, 21 March 2018
“I’ve got something of an open mind, you know. I don’t have a sort of fixed position.”
Speaking on the issue of new North Sea oil and gas in a New Statesman interview, 3 June 2026
“We would fight this in GM [Greater Manchester]…Communities across the north would face all the danger and disruption while big oil and gas walk away with all the profits.”
In response to Reform’s call for fracking, on X, 25 August 2025
“I am proud to endorse the fossil-fuel treaty proposal today on behalf of Greater Manchester. It’s not just a plan – it’s a lifeline. It’s a call to end coal, oil and gas, hold polluters accountable…I urge all governments, nationals and subnationals to join this fight.”
Statement upon endorsing the fossil-fuel treaty, 5 June 2025
“Fracking is the past, it is not the future.”
Speech at London climate protest, 20 September 2019
“I have called for a moratorium on fracking. Far too many potential risks and unanswered questions.”
On X, 22 June 2015
“What I would do, if successful, is lay out a plan for more public control over water, energy, transport, so that over the period we can get those bills down, fares down, and give people and give businesses breathing space.”
LBC interview, 2 July 2026
“I am all in favour of tough decisions at a national level. I don’t believe there should be a third runway at Heathrow, for instance. But I think those are decisions for national government.”
Guardian interview, 13 June 2019
“There is a debate to be had about aviation, isn’t there? There are changing public attitudes about aviation. Rather than just saying no to people flying, don’t we need to accelerate research into low and zero-carbon forms of aviation?”
Guardian interview, 13 June 2019
“Today, I stand alongside the mayors of some of the greatest cities in the world. I’m committed to a cleaner, greener and healthier future for Greater Manchester. Around a third of greenhouse gas emissions in our city-region come from transport.”
When signing the C40 Fossil-Fuel-Free Streets Declaration, which includes support for zero-emissions vehicles and walking and cycling, on behalf of Manchester, 14 September 2018
This article was updated on 20 July to reflect Burnham replacing Keir Starmer as UK prime minister.
In an interview with Carbon Brief, Kurum says that the target was not a political choice, but instead reflects the latest evidence on “what is needed to keep 1.5C within reach”.
The ongoing Hormuz crisis means there is an “urgent” need for renewables and electrification, which are the “surest and cleanest way to protect citizens” from high energy prices.
Kurum says that the Brazilian and Ethiopian presidencies of COP30 and COP32, as well as the EU, UK and Canada, have welcomed the target.
He adds that “all have confirmed it will be central to discussions at COP31”.
In the interview, Kurum – who is also Turkey’s minister of environment, urbanisation and climate change – tells Carbon Brief where the target came from and what he expects to happen next.
Carbon Brief: You recently launched a target for 35% of the world’s final energy to come from electricity by 2035. Where did this idea come from?
Murat Kurum: The “35 by 35” target is grounded in technical data and based on the IEA [International Energy Agency] and IRENA [International Renewable Energy Agency] analysis of what is needed to keep [the 1.5C Paris Agreement target] within reach. The level was not chosen politically. Rather, it reflects what the science and the energy modelling tell us is required.
CB: Why do you think an electrification target is important right now?
MK: The case for the target is urgent right now. The latest war in the Gulf has made energy diversification – and, in particular, renewable energy transition and electrification – a top global priority, because it is the surest and cleanest way to protect citizens around the world from high and volatile energy prices.
At a time of real fragmentation in international relations, a single, shared target is needed to focus global efforts by aligning governments, businesses and investors behind a common benchmark and to send a clear market signal.
CB: Which countries are supporting this target so far?
MK: The reaction so far has been extremely positive and, while we presented our target at the UN June climate meetings in Bonn, our earlier conversations with parties at both the Petersberg and Copenhagen climate dialogues paved the way for this launch.
For example, the EU, UK, and Canada have welcomed the target, as have the Brazilian COP30 and Ethiopian COP32 presidencies. All have confirmed it will be central to discussions at COP31.
This support has been reflected in the business community as well, with polling by the We Mean Business Coalition showing that 90% of businesses expect to have largely electrified their operations by 2035 and that 88% expect electrification will make their business more competitive.
CB: How do you hope and expect to see this taken forward at the COP? Could it be in the formal COP outcomes, or part of the second global stocktake?
MK: We are now taking electrification forward as an “action agenda” initiative to bring actors together and drive progress. The action agenda and the [formal COP] negotiations are separate, but complementary, with different processes and thresholds, and it is too early to say what all countries might be able to agree in the negotiations. That is for parties to determine as the year progresses.
We are focused and determined to use COP31 as a moment to spark a global conversation about electrification.
CB: What are the key priorities for reaching the target?
MK: The critical sectors for reaching the target are buildings, transport and industry, which together account for around 45% of global emissions. Financial support for the developing world and investment in grids and infrastructure is also crucial.
The target also builds on COP28’s target to triple renewable energy capacity and seeks to take advantage of the tumbling cost of renewable power and other technologies critical to the energy transition. This is a journey that Turkey itself is taking ambitious steps on, including our plan to reach 120GW [gigawatts] of renewable capacity by 2035.
This interview was first published in the 10 July 2026 edition of Carbon Brief’s DeBriefed weekly newsletter. Sign up for free.
]]>RECORD HEAT: Western Europe experienced its hottest June on record – some 3C above average – according to analysis covered by the Guardian. It said the finding came “as the UK enters its third heatwave of the year and wildfires ravage France and Spain”. Le Monde said 10,000 people had been evacuated due to wildfires in southern France.
‘EXCESS DEATHS’: The June heatwave killed more than 2,700 people in France, according to a guest post analysis for Carbon Brief. Similar analysis for Germany said there had been more than 5,000 “excess deaths”, reported Bloomberg. Meanwhile, an ongoing heatwave in the US has killed at least 30 people, said USA Today.
STORM TEST: Floods have killed 39 people in Guangxi province in southern China, said state-run newspaper China Daily. Scientists warned that climate change and the weather phenomenon El Niño are exposing China to “catastrophic storms” that will test its resilience in 2026, reported Reuters. The nation’s latest official climate report found that “extreme weather and climate events…have become more frequent and severe”, said China National Radio.
The share of Irish electricity used by data centres in 2025, reported the Irish Times.
The share of global electricity used by data centres in the same year, according to Carbon Brief analysis of the Energy Institute statistical review.
(For more, see Carbon Brief’s in-depth daily summaries of the top climate news stories on Monday, Tuesday, Wednesday, Thursday and Friday.)
Carbon Brief explained – via eight facts – why air conditioning rates in some parts of Europe are relatively low, as the technology emerges as a new front in the global “culture war” over climate action. Analysis for the article illustrated that, in many parts of the world’s fastest-warming continent, air conditioning simply was not needed in the past.
This week, Carbon Brief interviews Murat Kurum, president-designate of the COP31 UN climate talks in November and Turkey’s minister of environment, urbanisation and climate change, on his target to boost global electrification.
Carbon Brief: You recently launched a target for 35% of the world’s final energy to come from electricity by 2035. Where did this idea come from?
Murat Kurum: The “35 by 35” target is grounded in technical data and based on the IEA [International Energy Agency] and IRENA [International Renewable Energy Agency] analysis of what is needed to keep [the 1.5C Paris Agreement target] within reach. The level was not chosen politically. Rather, it reflects what the science and the energy modelling tell us is required.
CB: Why do you think an electrification target is important right now?
MK: The case for the target is urgent right now. The latest war in the Gulf has made energy diversification – and, in particular, renewable energy transition and electrification – a top global priority, because it is the surest and cleanest way to protect citizens around the world from high and volatile energy prices.
At a time of real fragmentation in international relations, a single, shared target is needed to focus global efforts by aligning governments, businesses and investors behind a common benchmark and to send a clear market signal.
CB: Which countries are supporting this target so far?
MK: The reaction so far has been extremely positive and, while we presented our target at the UN June climate meetings in Bonn, our earlier conversations with parties at both the Petersberg and Copenhagen climate dialogues paved the way for this launch.
For example, the EU, UK, and Canada have welcomed the target, as have the Brazilian COP30 and Ethiopian COP32 presidencies. All have confirmed it will be central to discussions at COP31.
This support has been reflected in the business community as well, with polling by the We Mean Business Coalition showing that 90% of businesses expect to have largely electrified their operations by 2035 and that 88% expect electrification will make their business more competitive.
CB: How do you hope and expect to see this taken forward at the COP? Could it be in the formal COP outcomes, or part of the second global stocktake?
MK: We are now taking electrification forward as an “action agenda” initiative to bring actors together and drive progress. The action agenda and the [formal COP] negotiations are separate, but complementary, with different processes and thresholds, and it is too early to say what all countries might be able to agree in the negotiations. That is for parties to determine as the year progresses.
We are focused and determined to use COP31 as a moment to spark a global conversation about electrification.
CB: What are the key priorities for reaching the target?
MK: The critical sectors for reaching the target are buildings, transport and industry, which together account for around 45% of global emissions. Financial support for the developing world and investment in grids and infrastructure is also crucial.
The target also builds on COP28’s target to triple renewable energy capacity and seeks to take advantage of the tumbling cost of renewable power and other technologies critical to the energy transition. This is a journey that Turkey itself is taking ambitious steps on, including our plan to reach 120GW [gigawatts] of renewable capacity by 2035.
HEATED: A Financial Times long read asked if Europe – the world’s fastest-warming continent – is “prepared for a world of extreme heat”.
LITIGATED: The Outrage and Optimism podcast spoke to Prof Joana Setzer and Catherine Higham about the latest trends in climate litigation.
‘SHATTERED’: Confidence in fossil-fuel exports via the strait of Hormuz has been “shattered”, wrote IEA chief Fatih Birol for Foreign Policy.
DeBriefed is edited by Daisy Dunne. Please send any tips or feedback to debriefed@carbonbrief.org.
This is an online version of Carbon Brief’s weekly DeBriefed email newsletter. Subscribe for free here.
France, Germany and the UK have experienced record-breaking heat and thousands of heat-related deaths this summer, with June temperatures in many regions passing 40C.
This has drawn attention to the relatively low rates of AC use in these countries – and in Europe as a whole – especially when compared to its widespread adoption in the US.
Legacy newspapers, bloggers and even Elon Musk have all weighed in on “European hostility” to AC, criticising Europe’s “cultural conservatism” and “overbearing governments”.
Right-wing politicians, including National Rally in France and the UK Conservatives, have styled themselves as champions of AC, while opposing efforts to tackle climate change.
Missing from most of these interventions is the fact that human-caused climate change has made once-rare heat far more common, in what is the world’s fastest warming continent.
Carbon Brief analysis for this article shows that, until the 2020s, it was rare for many European cities to see days above 30C, making AC an unnecessary expense.
Here, Carbon Brief explains – via eight facts – why AC rates in some parts of Europe are relatively low, as well as clarifies and contextualises some of the misleading claims circulating about the technology.
AC installation rates in northern parts of Europe are very low. The best available estimates suggest that 6% of households in Germany and just 4% in England use AC.
However, these rates are largely explained by the historical climates in these nations.
Unlike the US, much of the housing stock and infrastructure in Europe was built at a time when AC did not exist and was not necessary.
Moreover, nations such as France, Germany and the UK have only started to regularly experience extreme heat in recent decades.
The chart below shows the average number of days per year, in each decade since the 1950s, when maximum temperatures have exceeded 30C in major European cities. Capitals such as London and Paris have seen a significant jump since around 2000.
Prof Jan Rosenow, an energy and climate researcher at the University of Oxford, tells Carbon Brief:
“For most of the 20th century, northern Europe simply didn’t need cooling. Homes in Britain and Germany were built to keep heat in, not out, because winters were cold and summers rarely hot.”
Much of the commentary about the relatively low rates of European AC use focuses on cultural or “ideological” factors. (See: Some European nations have ‘resisted’ AC – but its popularity is growing.)
However, Rosenow says people’s views on AC in these countries likely stem from their historically colder climates. He adds:
“Attitudes formed around those facts, not the other way round…There is a cultural element, but it is the product of climate, not of some green ideological project.”
In the past, many in Europe relied on traditional methods to keep buildings cool. Richard Black, head of communications at Climate Analytics, made this point in a post on LinkedIn:
“Once, residents of cities such as Paris could cope with summer heatwaves by opening shutters and windows during the night, and closing them again in the morning to trap the cool air inside…We’ve reached a limit to this sort of adaptation.”
Now, with Europe around 2.5C warmer than pre-industrial levels, climate change is routinely driving record-breaking heatwaves, even in the north of the continent.
This is forcing a reappraisal of societies that were “built for a climate that no longer exists”, as the UK’s Climate Change Committee (CCC) put it in a recent report.
Experts broadly agree that much of Europe will indeed need more AC, particularly in spaces housing the most vulnerable populations, such as care homes, schools and hospitals.
At the same time, they also emphasise broader, “passive” efforts to make cities and homes cooler alongside increased AC use. (See: AC is not the only answer to overheating cities.)
During periods of extreme heat, articles criticising “European hostility” towards the technology frequently note that “only about 20%” of households in Europe have AC.
Often, this is contrasted with the US, where more than 90% of households have AC installed. (In fact, the US is something of a global outlier, matched only by Japan.)
However, the continent-wide figure for Europe obscures the reality. In southern Europe – where temperatures are and have always been higher – AC is relatively common.
The map below, based on official EU data, shows that southern European nations use far more household energy for “space cooling” than those in the north.
Government figures show that nearly 60% of Italian households have AC. Household-level data in many countries is patchy, but various analyses have placed that figure at 70-80% in Greece and 41% in Spain – with higher penetration in the hotter, southern part of the country.
The same pattern can be seen within France. International coverage has stressed the country’s “cultural resistance to AC”, citing a nationwide figure from 2020 that suggests “only” 25% of French households have AC.
However, polling data from customers of the Hello Watt energy app suggests that there is a distinct north-south divide in French uptake. At least 60% of households in Mediterranean regions of France are equipped with AC, according to these figures.
This can be seen in the map below, with households across northern regions, including Paris, reporting far lower AC installation rates, often below 5%.
Finally, when making such comparisons to Europe, it is worth noting that high rates of AC use reported for the entire US also obscure significant differences between – and within – US states. This, too, aligns with differences in regional climate.
Hotter states in the US south have near-universal AC access. But in Washington, a north-western state with a climate more comparable to that of western Europe, 66% of people have AC in their homes.
International commentators have written extensively about Europe’s “longstanding resistance to cooling technology”, especially when compared to the US.
Newspaper editorials in the Washington Post and the Wall Street Journal, alongside numerous op-eds and blog posts, have added fuel to this “culture war”. Elon Musk has even promoted an AI-generated message stating that Europeans “should just install AC”.
Often, European attitudes are attributed to “guilt” about AC’s energy demand, “cultural conservatism” or “overbearing governments”. One commentator ascribed divergent attitudes in Europe and the US to “different ideas about physical suffering and sacrifice”.
Meanwhile, right-leaning commentators and climate-sceptic groups have blamed “climate policies, which view AC as an unnecessary luxury”.
In general, these critiques often fail to consider the most obvious explanation, which is that AC adoption is low in northern Europe because the historical climate made AC unnecessary.
Critical articles have instead drawn attention to restrictions on AC use in some European countries, as well as the lack of support for AC in official heatwave guidance.
For France, in particular, polling has indeed highlighted widespread disapproval of AC, both on environmental grounds and due to alleged health impacts. Such messages have also been voiced regularly in French media and by left-leaning and green politicians.
However, across Europe there are plenty of signs that such attitudes are shifting, following successive spells of extreme heat.
Amid the June heatwave, there were reports from Germany, France and the UK of “skyrocketing” AC sales. This surge was even acknowledged by the foreign ministry in China, due to the nation’s role in supplying many of these products.
The shift is taking place in politics as well. Marine Tondelier, leader of the French Green party – which has traditionally opposed AC – recently stated that “there are places where we just can’t do without AC anymore”.
Overall, AC has been on the rise across Europe, with France, Spain and the Netherlands all using more than twice as much energy for AC and other “space cooling” technologies in 2024 as they did in 2015.
AC production in Germany has also risen by at least 75% in recent years and a growing share of German homes are being built with it installed.
Notably, there is little evidence that “climate policies” are blocking Europeans from installing AC. Polling in Germany shows that, while people are concerned about environmental impacts, the high costs of installing and running it are perceived as greater barriers.
Finally, there is an important distinction between individual AC units in people’s homes and installing them in public spaces, such as hospitals, care homes and schools.
While neither is widespread in France, support for the latter can increasingly be found across the political spectrum, from Greens to the far-right National Rally (RN).
Some people have noted that a wider rollout of AC in Europe could drive up emissions.
As noted in the Financial Times by columnist and chief data reporter John Burn-Murdoch, there is a logic to this argument, “at least superficially”. He writes:
“AC uses a lot of energy; if the proposed defence against emissions-driven global warming means emitting more, then we have an obvious problem.”
The emissions impact of AC depends heavily on the generation mix of a country’s power sector.
According to the International Energy Agency (IEA), “space cooling” – mostly AC, but this does include some fans – used 2,100 terawatt-hours (TWh) of power globally in 2022.
As such, it was responsible for 1bn tonnes of carbon dioxide (CO2) from electricity use globally. This equates to around 2.7% of total CO2 emissions globally from fossil fuels and industry.
(As well as indirect emissions through power use, AC units can also directly release greenhouse gases – used as AC refrigerants – when they leak or are improperly disposed of. Following the 2016 Kigali Amendment, countries are progressively trying to phase down the use of potent greenhouse gases in AC units.)
In a LinkedIn post, Lauri Myllyvirta, lead analyst at the Centre for Research on Energy and Clean Air and regular Carbon Brief contributor, says:
“There is a lot of alarmist messaging about how much electricity AC uses. However, on an annual basis, the demand is not that substantial. Currently, AC uses about 1% of electricity in the EU and catching up to adoption rates in the US would double this.”
According to the IEA estimates from 2018, “if left unchecked, energy demand from AC will more than triple by 2050”, reaching 6,200TWh of power.
By mid-century, households would contribute the most to the increase (70%), with at least two-thirds of the world’s households potentially having AC, according to the Paris-based agency.
Decarbonising electricity grids and energy-efficiency improvements can reduce AC emissions and their impact on climate.
For instance, in countries with a low-carbon electricity mix – such as France, where nuclear energy accounts for 67% of its electricity generation – expanding AC would have a more limited climate impact than in other countries.
In countries such as India, there could be a more significant increase in emissions as AC is adopted, due to the role coal plays in the country’s energy mix, especially during the night. Demand is growing fast – following low access historically – and many AC units are inefficient, with high electricity use.
According to a new working paper from the India Energy and Climate Center (IECC) at the University of California, Berkeley, “room AC” – portable plug-in units, as opposed to those permanently installed in buildings – already accounts for nearly one-quarter of India’s peak electricity demand (60-70GW) – and this is before the majority of Indian households have bought their first AC unit.
Dr Nikit Abhyankar, co-faculty director of the IECC, tells Carbon Brief that, as AC use is expanded across the world, it should be paired with solar and battery storage, where the “economics have completely shifted” in the last few years. This will help to cut both energy bills and emissions.
According to the IEA, accelerating energy efficiency improvements could deliver more than one-third of all CO2 emission reductions between now and 2030.
The global energy demand needed to run ACs alone in 2050 could be reduced by 1,300GW – the equivalent of all of China and India’s coal plants – through energy efficiency measures, it estimates.
Aditya Valiathan Pillai, a climate adaptation researcher at King’s College London, tells Carbon Brief that, as the use of AC expands, there is a conversation to be had about where and “what type of technology [is used] and who gets access” to it.
A final point is that many AC units are air-to-air heat pumps, which can efficiently heat homes, as well as keeping them cool. As such, wider AC adoption could boost the adoption of electrified heat, helping to cut emissions from gas boilers.
Some critics of AC mention its electricity demands and associated CO2 emissions from fossil-fuel combustion, which contribute to raising the temperature of the entire planet. (See: AC emissions are growing, but its climate impact could be limited.)
But AC also has a localised impact. It works by removing heat from indoor air and pushing it outdoors, raising temperatures on the street and exacerbating the “urban heat island” effect.
Left-leaning French politicians are among those citing this as an argument against AC, particularly in cities. Indeed, Emmanuel Grégoire, the Socialist mayor of Paris, appeared to be making this point in an interview with Le Monde, during the June heatwave:
“[AC] can be useful for cooling collective spaces and protecting the most vulnerable populations, but individual AC is a scourge – it makes the problem worse by heating the city even more.”
One study concludes that, in a city such as Phoenix, Arizona, where the technology is widespread, AC use during a heatwave can raise night-time temperatures by 1-1.5C.
Another models a nine-day heatwave in Paris – in a future with “massive” AC use – and finds an increase in external temperature of more than 2C, due to heat emitted by the units.
Given this, some scientists argue that AC can be a form of climate “maladaptation” – referring to actions that backfire and make people more vulnerable to global warming.
The Intergovernmental Panel on Climate Change (IPCC) has highlighted this issue, concluding:
“AC may constitute a maladaptation because of its high demands on energy and associated heat emissions, especially in high-density cities.”
Compared to the US, more people in Europe live in dense, urban areas. According to Dr Vincent Viguié, a climate change economist at École des Ponts ParisTech, this could leave Europeans more exposed to heat from AC units. He tells Carbon Brief:
“If you live in a neighbourhood that is not dense, like in a suburban neighbourhood or in the countryside, you don’t care about this…So, once again, there is a key difference between US and European cities.”
Viguié is among the experts arguing that other climate-adaptation measures should be considered alongside AC, to keep entire cities cool – not just individual homes. He says:
“It’s not to say that the heat released by AC by itself is a reason to forbid AC…It’s just that not taking that into account may lead to bad decisions.”
Heatwaves can be deadly, especially for older or vulnerable members of society.
According to climate scientists at World Weather Attribution, “heatwaves cause more deaths in Europe than all other natural hazards combined”.
The heatwave in June 2026 is estimated to have killed more than 20,000 people in Europe. In France – which has seen some of the hottest temperatures – the heatwave caused more than 2,700 heat-related deaths, according to analysis published by Carbon Brief.
AC does help to protect people from the effects of extreme heat. A 2021 study found that globally, AC averted an estimated 190,000 heat-related deaths annually during 2019-21.
With its much higher penetration of AC, the US has fewer deaths due to extreme heat than Europe.
Heat kills around 11 people out of every 100,000 in Europe, compared to around two people in the US, according to analysis by data scientist Dr Hannah Ritchie from Our World in Data.
Several publications have pointed out that “Europe’s heatwaves are deadlier than American gun violence”. While this is technically accurate in absolute terms, Ritchie says the comparison is “a bit silly” for a number of reasons, not least because on a per-capita basis, US gun deaths are higher.
However, experts suggest that AC is only one part of a wider effort to protect people from extreme heat.
A 2020 study looking at heat-related mortality in Canada, Japan, Spain and the US, found that excess deaths due to heat decreased between 1972 and 2009.
For example, the proportion of deaths due to extreme heat fell from 1.7% to 0.5% over the period in the US and 3.5% to 2.8% in Spain.
However, an increase in AC only explained 16.7% of the drop in the US and 14.3% in Spain.
The research concludes that “other factors have played an equal or more important role in increasing the resilience of populations”. This is supported by research that shows changes to cities, such as planting more trees, as well as behavioural shifts and public-health measures, can all protect people from dangerous heat.
Additionally, across Europe there is already a range of policies and measures in place to protect the most vulnerable from heatwaves. Many of these were brought in following the unprecedented summer of 2003, when 70,000 died from extreme heat.
These policies were highlighted by French environment minister Agnès Pannier-Runacher, in response to the far-right National Rally (RN) party’s AC proposals:
“The incompetent RN has just found out that nursing homes need air-conditioned rooms. Thank you, but it’s actually been mandatory since 2004.”
Another study found that measures that have already been rolled out in France would cut the projected death toll of a 2003-like heatwave by more than 75%. This is in part due to the expansion of AC in places such as nursing homes, but also other approaches, such as heat action plans.
For example, France has a multi-tiered action plan, which includes local governments ensuring access to cooled spaces and water, keeping a list of vulnerable individuals for targeted interventions, as well as national information campaigns.
According to the UN’s office for disaster risk reduction, this French plan has led to a “significant reduction in heat-related mortality”.
While action plans have proved successful in a number of nations, less than half of European countries have such a plan in place.
In the UK, Conservative politicians and right-leaning media have tried to pit the adoption of AC against net-zero policy.
Writing in the climate-sceptic Daily Telegraph, columnist Matthew Lynn claimed falsely:
“Strict net-zero rules now mean that aircon is effectively banned in the UK.”
(Further down the article, he concedes: “AC is not strictly speaking banned in new-build homes in the UK. But tough environmental rules mean that it is very hard, and expensive, to install in practice.”)
The same narrative has been used in articles by GB News, the Sun and others. A separate article in the Daily Telegraph’s “money” section goes further, claiming that AC had been “torn from homes under net-zero clampdown”.
A blog post from the Ministry of Housing, Communities and Local Government rebuts these claims, stating:
“There has been media coverage this week suggesting that AC is banned in homes. This is incorrect.”
For the UK, while it is true that fewer than 5% of homes currently have AC, this is largely due to the fact that it was not hot enough in the past to warrant the expense. Historically, the focus has therefore been on keeping buildings warm, rather than cool.
Extreme heat has previously been rare in the country, so homes were built with insulation and other measures to keep heat in during the “dank winters”. (See: Much of Europe has not needed AC in the past.)
Current regulations do not ban the installation of AC outright. However – as the government’s blog post notes – there is no blanket rule, meaning there are some localised differences.
Certain areas – or certain kinds of properties – may be subject to additional complications for installing AC.
In a 2025 video on Instagram, shadow secretary of state for energy security and net-zero Claire Coutinho referenced the London plan, for example, which is a framework for development in the capital launched in 2021. She said:
“[London mayor] Sadiq Khan says no. The London plan says we shouldn’t have air con because it uses too much energy. But this is mad! This is a poverty mindset that we need to get away from.”
The London Plan does not stop homes from having AC. It simply says that, for new buildings, passive design measures should be prioritised, such as the orientation of the building, the window design and incorporation of measures such as external shading and trees.
A recent response from the mayor added further measures, such as the need to “minimise the necessity for the operation of mechanical measures including AC, which would further add to the heat island effect within urban areas and add operational cost to residents”.
Elsewhere, new-build homes across England must meet the requirements of “part O” of the 2022 building regulation updates. This includes addressing overheating in buildings through energy-efficient design and prioritising passive cooling, with AC as a last resort.
For existing buildings, most AC units fall under “permitted development rights”, meaning no planning application is required to install them.
Additionally, regulations were relaxed in 2025 to make it easier to install an air-to-air heat pump – which can both heat and cool air – without planning permission.
This means that, far from blocking the expansion of AC, net-zero policy has made it easier to install specific cooling systems.
Speaking to Carbon Brief, Andrew Sissons, director of sustainable future at Nesta, says the government must now implement its announced £2,500 subsidy for air-to-air heat pumps “as quickly as possible”, to further ensure that the technology can be rolled out efficiently. He adds:
“[The government] should also continue to expand permitted development rights for air-to-air heat pumps, with a particular focus on flats and homes in denser areas. As long as heat pumps meet the MCS [Microgeneration Certification Scheme] noise test, there are few reasons to limit their use via the planning system.”
Some properties, such as large homes, listed buildings or those in conservation areas, may still require planning permission to install an air-to-air heat pump or other AC. Sissons notes that this can add cost and delay to installation.
While it cannot be said that AC has been blocked or banned due to net-zero, neither has it been prioritised.
This may shift as temperatures continue to rise. UK government advisors at the Climate Change Committee (CCC) suggest that 22% of the UK’s housing stock will likely need active cooling, such as AC, to cope with 2C of global warming.
The CCC’s recent adaptation report also calls for all new homes to be built using low-cost, passive cooling measures, alongside more AC.
Active cooling such as AC is more likely to be needed for retrofitting existing homes, the report adds.
AC has become increasingly politicised in Europe, as demonstrated by France’s RN party announcing its “grand plan for AC” in all public buildings.
As noted by Dutch MEP Gerben-Jan Gerbrandy, this “far-right” embrace of AC is coming from the same people who for years have “delayed emissions reductions”.
In response, left-leaning policymakers in Europe have frequently downplayed the role of AC, prioritising programmes of urban greening and retrofitting older buildings.
Such approaches for dealing with extreme heat have already proved successful. Therefore, many experts argue that these methods, alongside AC, will be essential to prepare for a hotter world.
According to the IPCC’s sixth assessment report, adaptive infrastructure, such as urban forests and green roofs, can reduce energy use because of cooling, with co-benefits for climate, air quality, physical and mental health.
While retrofitting older buildings for heat as well as insulating them from the cold might prove challenging, urban greening and an active shade policy – one that determines how much of every street is exposed to direct sunlight – are simple measures cities can adopt.
Some experts have also warned about the high cost of running AC, expressing concerns that excessive reliance on the technology could increase energy poverty.
In a Carbon Brief guest post published in 2025, researchers at the Basque Centre for Climate Change found that framing AC as the “default solution” can miss the opportunity to design “more inclusive, human-centred responses” to rising temperatures.
William Lewis, a PhD candidate and one of the guest post’s authors, tells Carbon Brief it is not a case of “one or the other”, when considering AC and other options:
“We have this opportunity in European countries to choose a slightly different path [from the US], which isn’t AC in every single home.”
King’s College London’s Pillai says that, by centring the debate on AC, the far-right response to the heatwaves in Europe has “completely neglected the science of how you cool human beings”.
There are many solutions, he adds, that are already widely used across hot developing countries, such as ceiling fans, windows that open and cross-ventilation, as well as strategies to reduce cumulative hours of heat exposure.
Pillai tells Carbon Brief that, while places reaching 42C and higher “definitely need to think about AC very seriously”, places in the “low to mid 30Cs” could rely on these alternatives.
Behavioural change, he adds, is the “least glamorous part” of heat policy, but “pulls most of the weight” of protecting people. These include a wide range of actions and responses – from reducing heat exposure, to wearing lighter clothing and drinking more water and fluids.
There are also workplace protections. Pillai tells Carbon Brief that these could include legislation on mandatory work breaks, cooling and shade requirements at workplaces, as well as health insurance that covers heat stress days that have been lost by heat-exposed workers.
China Briefing handpicks and explains the most important climate and energy stories from China over the past fortnight. Subscribe for free here.
GUANGXI FLOODS: Severe floods hit south-western China’s Guangxi province after heavy rains, killing 39 people and leaving another nine missing, reported the state-run newspaper China Daily. “Torrential rain” caused by Typhoon Maysak overwhelmed rivers and reservoirs in the province, said the New York Times. The Southern Weekly reported that several villages in Guangxi’s Hengzhou city were submerged. An unnamed researcher told the outlet that “small and medium-sized reservoirs”, not just in Guangxi but nationwide, are “severely aged, making it difficult for them to effectively withstand floods caused by extreme weather events against the backdrop of global [climate] change”.
TORNADOES AND 50C HEAT: At least 11 people were killed by two “extremely rare” tornadoes in central China’s Hubei province also linked to Maysak, according to Reuters. Typhoon Bavi is “on course to hit China’s eastern coast” in the coming days, said BBC News. Meanwhile, Xinjiang province in the north-west and Hainan province in the south both experienced “prolonged and intense heatwaves” in June, reported finance outlet National Business Daily. It added that temperatures in Xinjiang reached 50C.
‘MORE FREQUENT AND SEVERE’: China is “warming faster than the global average”, reported state-run newspaper China Daily. It said the China Meteorological Administration’s 2026 “blue book” on climate change in China found that from 1961 to 2025, China’s “annual average temperature increased by 0.31C per decade”. The blue book also found that “extreme weather and climate events in China have become more frequent and severe”, said China National Radio. The outlet said this included extreme heat, precipitation events and typhoons.
‘BEAUTIFUL CHINA’ PLAN: The full text of the 15th five-year plan for building a “Beautiful China” outlines “seven key tasks”, including “actively addressing climate change”, reported Xinhua. The plan, re-published by BJX News, set quantitative targets for 2030. These included a 3% cut in carbon emissions per unit of production at industries included in China’s national carbon market. It added that the plan also called for “controlling and reducing coal use” and “reasonably controlling” the scale of coal-power capacity. Meanwhile, the outlet says, the government will “accelerate efforts” to ensure new electricity demand is met by clean energy. It also reported that the plan notes the need to “improve the capacity to respond to climate change” and to “actively participate and lead in” global climate governance. An op-ed attributed to a “commentator from this newspaper” in the environment ministry-run China Environment News said that the next five years are “pivotal” for the “Beautiful China” initiative.
OTHER FIVE-YEAR PLANS: The government also published a 15th five-year plan on “meteorological development”, calling for “enhanced” support for addressing climate change, said BJX News. It added that the plan emphasises the need to “participate deeply” in the work of the Intergovernmental Panel on Climate Change and “actively participate” in the World Meteorological Organization’s work on greenhouse gas monitoring. A third 15th five-year plan on developing a circular economy pledges to “address the shortcomings” in the recycling of clean-tech, reported finance outlet EastMoney. In a Q&A, a government official noted that used batteries, solar and wind power equipment “currently present particularly prominent challenges”, according to BJX News. The five-year plan for tourism encourages the use of carbon offsets and promotes “low-carbon travel”, said industry outlet China Travel News.
PEAKING ‘ACTION PLAN’: China released an “action plan” for peaking its carbon emissions “by 2030”, reported state news agency Xinhua. It added that the action plan reiterated China’s existing targets for carbon intensity and share of non-fossil energy in energy consumption. The plan calls on officials to “vigorously promote” non-fossil energy development and to accelerate efforts to improve “absorption” of new energy into the grid, according to International Energy Net. The plan “doesn’t seek to rein in the country’s fast-growing coal-to-chemicals industry”, said Bloomberg. It noted that the focus instead is on “low-carbon retrofits, reductions in coal consumption per unit of output and a gradual substitution of some fossil-based feedstocks and energy inputs”.
EU-CHINA TALKS: The EU and China have set an October deadline to “reset trade ties” as tensions over cleantech exports and other economic matters “rise”, reported Bloomberg. In a joint statement, the two sides established a “trade and investment consultation mechanism” with four workstreams, including trade and investment balancing and export controls, reported state news agency Xinhua. A joint statement, released by the European Commission, said the two sides agreed to “strengthen” dialogue and to “maintain…the stability of global industrial supply chains”.
AVENUES OF COOPERATION: A Chinese state-affiliated consulting firm and several European certification bodies have established a consortium to coordinate on “green electricity certificates”, aiming to “establish a network for mutual recognition of green power”, reported financial outlet Yicai. Meanwhile, China’s foreign ministry described increasing air-conditioner and fan exports to Europe during a record heatwave as a sign of the “complementary advantages” of EU-China trade, said Xinhua. This message was echoed in several articles by Chinese state-backed outlets. The People’s Daily noted that “as climate change drives more frequent and intense heatwaves…China’s industrial and energy capabilities are…helping address rising demand in Europe”.
PRESSURE ON COMPETITION: Meanwhile, China issued strict mandatory energy consumption and efficiency standards for the solar power industry in efforts to “curb overcapacity”, said financial news outlet Caixin. The country is “rolling back” tax exemptions for plug-in hybrids and electric commercial trucks, Caixin also reported, adding that fully electric passenger cars will not be affected.
China received $4.3bn in climate finance from the World Bank in 2020-2025, according to Carbon Brief analysis. The World Bank has dropped a pledge on climate-related lending, reported the Financial Times. The newspaper also reported that the bank will also “phase out its lending to China by 2031”. (China is estimated to have provided $3-4.5bn of climate finance annually to other countries, according to estimates by different thinktanks.)
A new database has mapped every climate initiative launched or run by China.
In this issue, Carbon Brief interviewed Dr Sun Yixian, professor of sustainability governance at the University of Bath, on what this data shows about China’s approach to climate “leadership”.
Below are highlights from the conversation. The full interview is published on the Carbon Brief website.
Carbon Brief: Your team has compiled a database of China’s “environmental leadership”. What do you mean by leadership?
Sun Yixian: In this project, what we are trying to look at is China’s role in global environmental governance – China’s shifting role, especially from a more passive participant in global governance processes to play a more proactive role in developing or managing its own initiatives on transnational or cross-border environmental governance.
So, [this includes] different environmental issues, but, of course, we found that climate change is a very important issue area. We have come up with a typology of different governance functions, trying to look at what specific activities Chinese actors are doing, or what kind of public goods Chinese actors are delivering, to the audiences of different initiatives.
CB: Could you explain what some of these climate initiatives look like in practice?
SY: In practical terms, there are all different kinds of initiatives. [The majority focus on] sharing information and building platforms, or developing capacity – capacity building activities, which can be training delivered by China to other countries.
Or also by providing funding, for example, China has created this south-south climate fund. It can also include research collaboration.
It can be traditional leadership activities, in the sense of developing certain international regulatory frameworks or rules or standards. It can also be pilot projects. China sometimes can start to work directly with some international partners to trial new ideas and new practices.
CB: The database stops at 2024 – just before the current administration withdrew the US from the Paris Agreement. Have you noticed any changes in China’s global climate engagements following this?
SY: I would say the trend is a continuous one, even [before] the withdrawal of the US…Over the past 10 years, we have seen an upward trend, with more and more new initiatives created by Chinese actors.
But I think the shift will probably help Chinese initiatives get more traction from their international partners – or countries or actors that haven’t been engaged very closely with China – to work more closely with China.
Whether or not this will translate into new initiatives or strengthen existing initiatives, I think that’s an open question.
CB: The theme of the data set is environmental leadership, but…Chinese officials have eschewed being called a climate leader. Would you say that China wants to be seen as a climate leader?
SY: We are entering into the implementation phase for the Paris Agreement. That means it is very difficult to create new agendas at this stage. [Instead the focus is] trying to see if countries can deliver.
If we want to see whether China is becoming a leader, we have to look at how fast, for example, China is accelerating its energy transition and how fast China can reduce its emissions.
Then, in terms of international engagement, what our data is trying to show is that China has become more proactive in that space.
When I was in China a few months ago, [leading experts] said the government…[is] not ready to become a global leader. But, at the same time, I think…in climate governance, but also in clean-energy supply chains – China is playing a leading role.
So, I think the question is whether this…will translate into the understanding, or mindsets, of policymakers or decision-makers.
This interview was conducted by Anika Patel via Zoom on 1 July 2026.
ENVOY INTERVIEW: Climate envoy Liu Zhenmin spoke to state broadcasting station CGTN about climate finance, expectations for China to “lead climate action” and trade tensions.
VIEW FROM THE US: The Atlas Live podcast hosted a debate on “what it will take” for the US to match China’s strength in manufacturing clean-energy technologies.
‘ELECTROSTATE’ EXPLORED: The state media-affiliated WeChat blog Yuyuan Tantian discussed how becoming an “electrostate” would boost China’s “resilience against external risks”.
HYDROGEN TARGETS: The Switched On podcast explored what China’s new targets for “green hydrogen” mean for the development of the industry.
China Briefing is written by Anika Patel, with contributions from Lekai Liu. It is edited by Simon Evans. Please send tips and feedback to china@carbonbrief.org
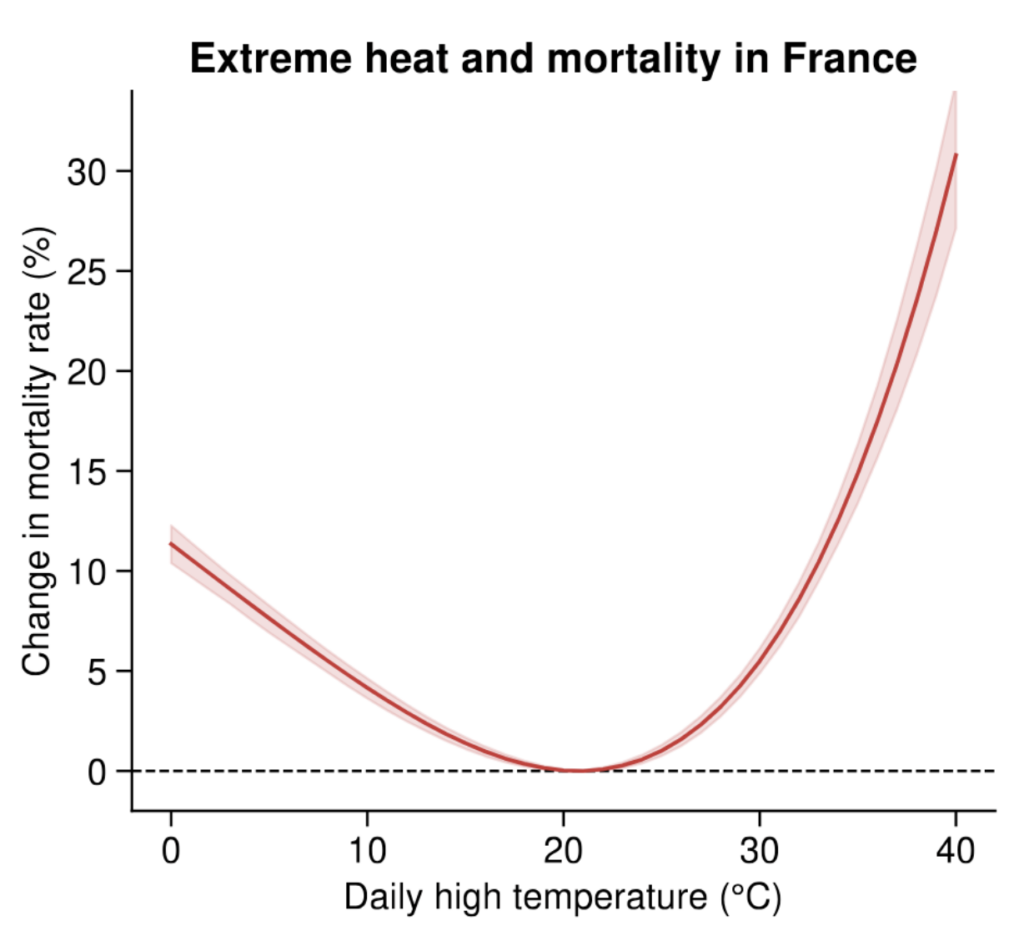
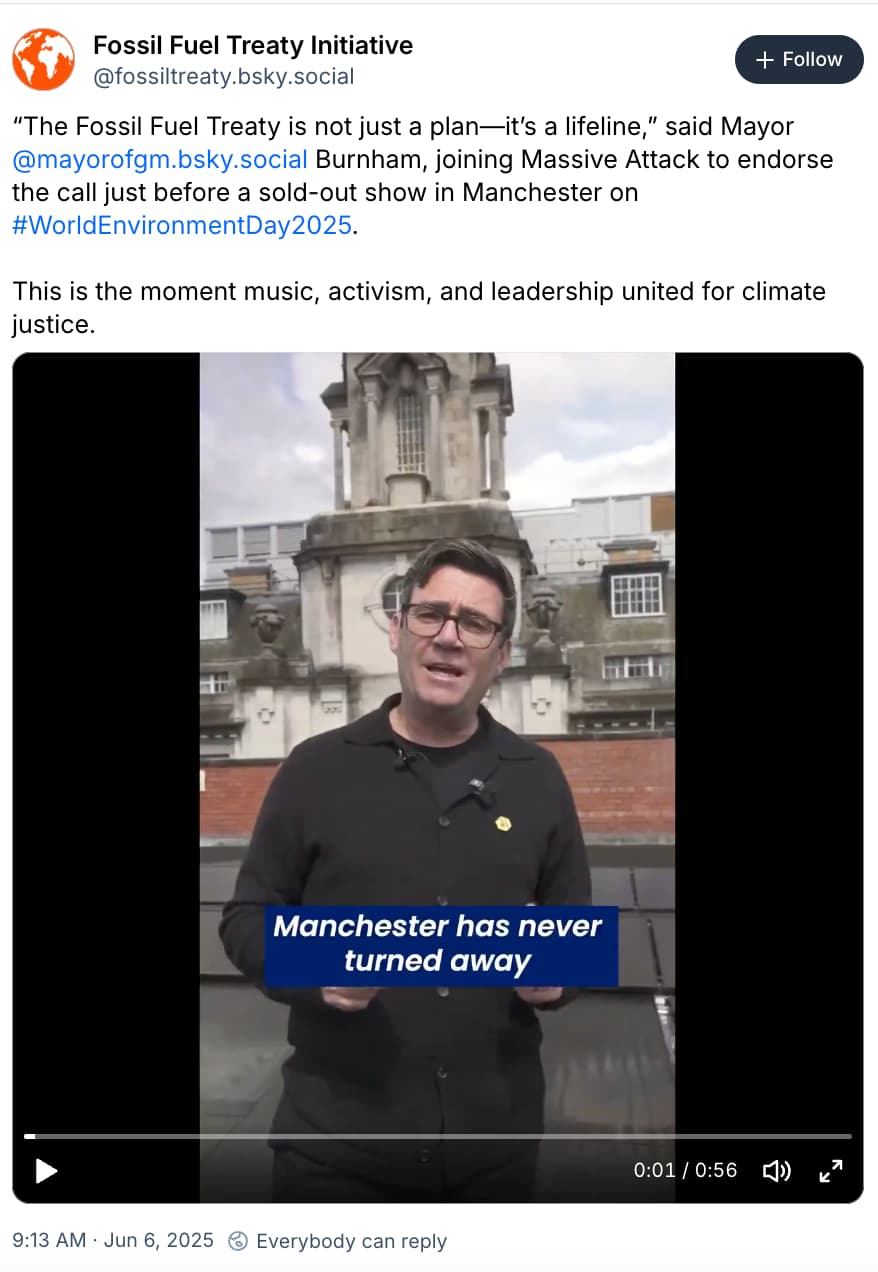
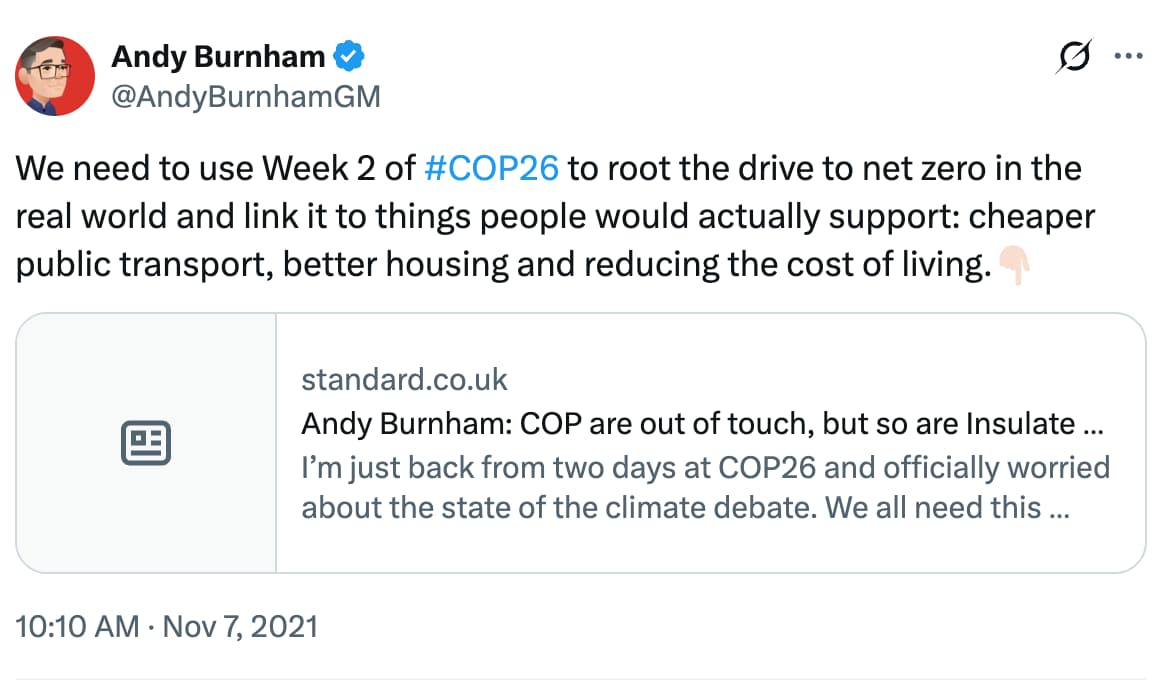
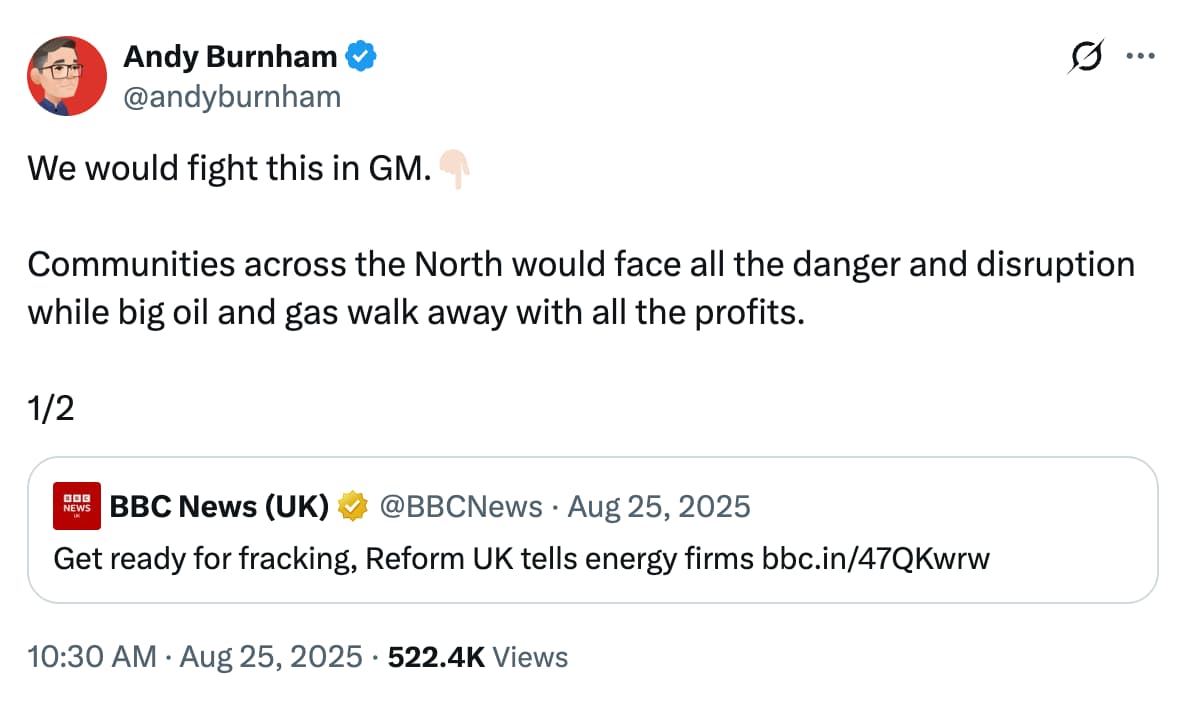
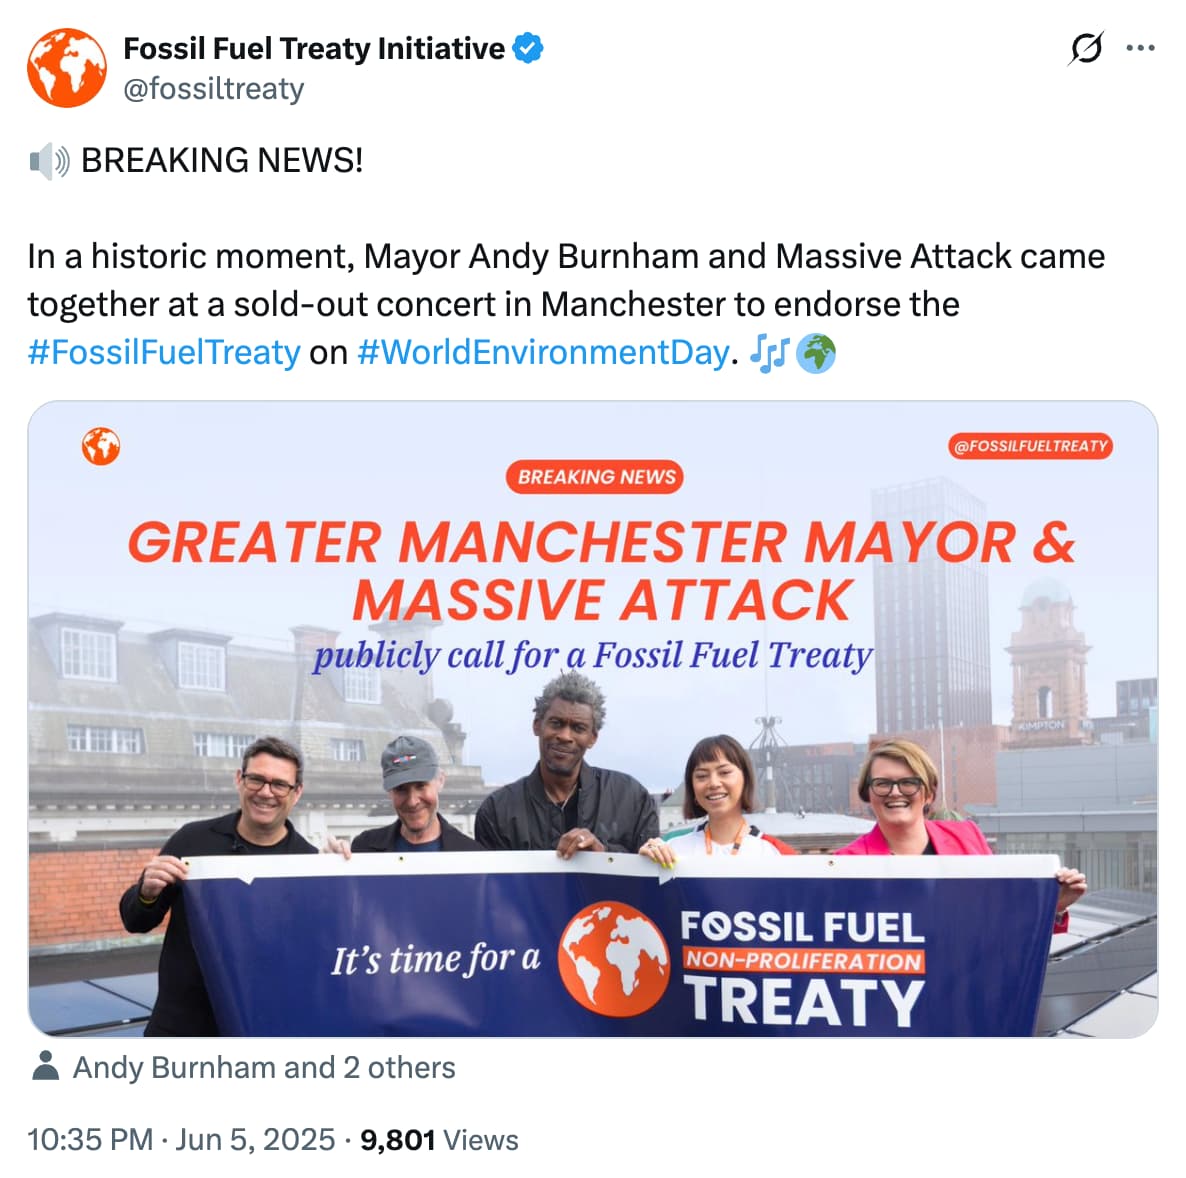