A new study, published in Science, pinpoints the direct relationship between carbon emissions and the amount of Arctic sea ice melt they cause as the climate warms.For every tonne of CO2 emitted into the atmosphere, summer sea ice cover in the Arctic shrinks by three square metres, the researchers say.For context, three square metres is a bit bigger than a standard UK pool table. And a tonne of CO2 is average emissions of a UK citizen every seven weeks.If the same relationship holds in the coming decades – which the authors are confident it will – this means they can pin down how much more CO2 it will take before the Arctic is sea ice-free in summer.The number they come up with is 1,000bn tonnes, or one trillion tonnes. This is the same as the IPCC’s carbon budget in 2011 for keeping global temperature rise to no more than 2C. The lead author tells Carbon Brief this means that with 2C of warming, “Arctic summer sea ice is gone”.
“If one flies from London to New York and back, the CO2 emissions for every seat cause three square metres of sea ice to disappear. Similarly, if one drives a car for, say, 1500 miles, another square metre of sea ice disappears.”
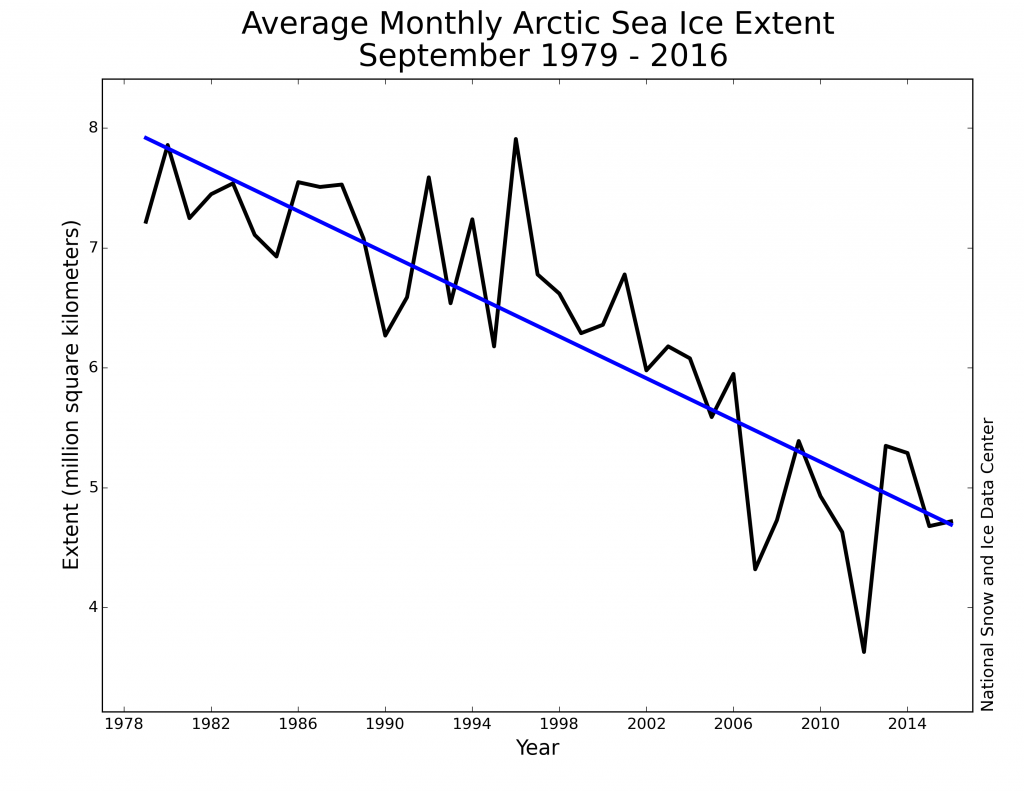
The end of the northern hemisphere summer is a key point in the Arctic calendar. It’s when the annual melt season comes to a close and sea ice reaches its smallest extent for the year.Arctic sea ice extent is declining in every season, but it’s in the trend from one summer to the next that the reduction is most pronounced. Since the beginning of the satellite record in 1979, Arctic sea ice cover in September has decreased by around 13% per decade.The new study highlights how the observed decline in September sea ice has a near-perfect relationship with the amount of CO2 that humans have emitted.Using data on September sea ice extent stretching back to 1953, the researchers find that three square metres of sea ice has been lost for every tonne of CO2 emitted from burning fossil fuels and producing cement.Looking at sea ice loss in this way highlights the impact of emissions, says lead author , head of the sea ice research group at the .This relationship doesn’t account for emissions from other greenhouse gases or other sources of CO2, such as those from land use change. While the impact of other gases is comparatively small, says Notz, including them would make the “three square metres” number a bit smaller.It’s also worth noting that the loss of sea ice doesn’t happen immediately after the CO2 is emitted – although the time lag is likely to be only a few years, says Notz.
“The starting point is today. We have about three million square km of sea ice left [in September], and given the observed sensitivity of three square metres per tonne, this area will be reduced to near zero once the additional 1,000bn tonnes have been emitted.”
“[The approach] directly relates somewhat un-relatable CO2 emissions in gigatonnes [billion tonnes] into a much more relatable sea ice area loss in square metres.”
“Because of this, I would avoid using an apparent correlation between historical concentrations of atmospheric CO2 and the extent of Arctic sea ice as a basis for future projections – despite its obvious appeal – and instead rely upon ensembles of climate model simulations.”
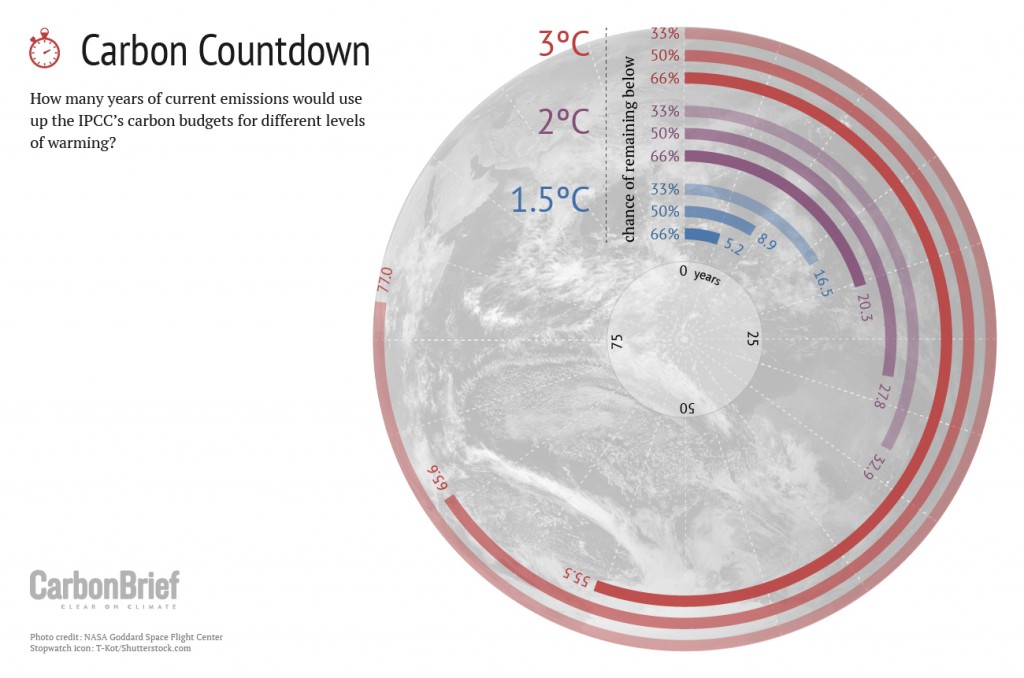
Scientists are interested in predicting when the Arctic will first become sea “” in summer – defined as the point at which sea ice extent falls below one million square kilometres. Using the relationship outlined in the new paper, the researchers calculate that another trillion tonnes of CO2 emissions would be enough to bring Arctic sea ice in summer below this threshold. Notz explains to Carbon Brief:A trillion tonnes of CO2 is the same as the IPCC estimated was left in the for a likely chance of staying below 2C, as of 2011. In 2016, five years worth of emission further on, that remaining budget has shrunk to around 800bn tonnes.This means that using up the 2C budget would also mean the end of ice during the Arctic summer, says Notz.The study illustrates a “very powerful way” to talk about carbon emissions, says , a fellow at the at the , who wasn’t involved in the study. She tells Carbon Brief:The relationship does appear to hold true in computer simulations of the future, says Notz. But sea ice is one of the most complicated elements of the climate system, notes , professor of earth observation at the , who wasn’t involved in the study.This means that it’s probably more accurate to base projections on a physical understanding of the processes, rather than a simple historical relationship, he tells Carbon Brief:
Carbon budget: A carbon budget is the maximum amount of carbon that can be released into the atmosphere while keeping a reasonable chance of staying below a given temperature rise. The Intergovernmental Panel on Climate Change (IPCC) first adopted the concept of carbon budgets in its 2013 report. Budgets are typically expressed in gigatonnes of carbon (GtC) or carbon dioxide (GtCO2). To convert the former to the latter, multiply by 3.67.
Carbon budget: A carbon budget is the maximum amount of carbon that can be released into the atmosphere while keeping a reasonable chance of staying below a given temperature rise. The Intergovernmental Panel on… Read More
“I look forward to using this in classes I teach in the future, to illustrate to students the real-world implications of the CO2 emission choices we can make.”
Article information
Notz, D. and Stroeve, J. (2016) Observed Arctic sea-ice loss directly follows anthropogenic CO2 emission, Science, doi:10.1126/science.aag2345
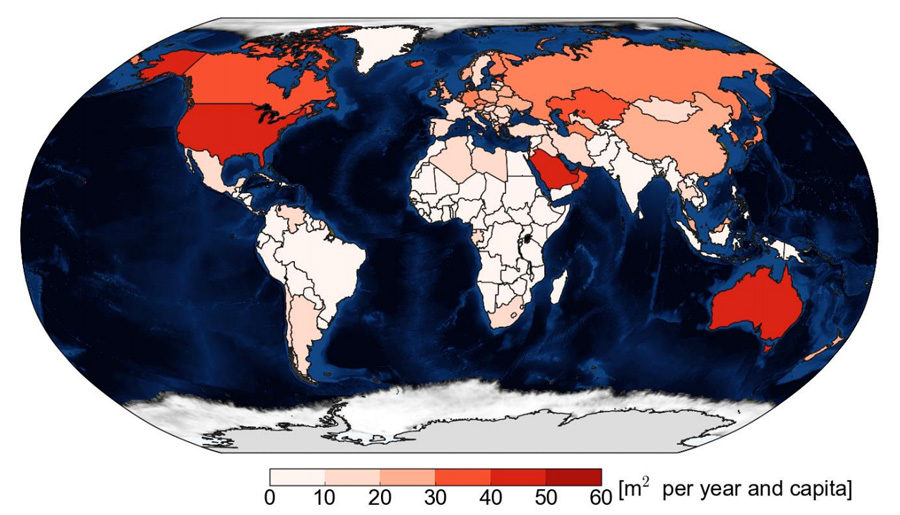
The authors also use the relationship between CO2 emissions and ice loss to suggest how individual countries are contributing to the decline of Arctic summer sea ice through their emissions.Factoring in countries’ populations, the authors go as far as expressing this responsibility per person. For example, they work out that based on 2013 per capita emissions, each person in the US will contribute about 50 square metres of future Arctic sea ice loss. The same is true for people in Australia and Saudi Arabia. You can see these countries shaded red in the map below.The country with the biggest per capita contribution is Qatar, whose 2013 emissions amount to almost 120 square metres of sea ice melt per person – that’s about the size of two squash courts.In contrast, the emissions in much of Africa and South America in 2013 are likely to contribute less than 10 square metres of ice loss per person, according to the study.It’s worth remembering here that this approach only accounts for CO2 emissions from fossil fuel burning and cement manufacture. So emissions of other greenhouse gases, and from land use change, aren’t included. An equivalent map including would show a much higher contribution from places like Brazil and Indonesia, for example.Similarly, the map would also look quite different were it to include emissions from past years going back over the industrial period, not just emissions in 2013. Nevertheless, the study highlights how much Arctic sea ice melt can be prevented by cutting emissions, says Jahn: