Six tips for creating a good climate change graphic
Can you make a simple, eye-catching graphic about climate change without compromising on the science? This is a question climate scientists often grapple with.A group of scientists from Philadelphia in the US and the University of East Anglia say in a new Nature paper that it can be done. Using evidence about how the brain processes and creates meaning from visual information, the researchers explain the evidence behind what makes a good climate change graphic. They also, helpfully, offer some guidelines for scientists on how to go about doing it themselves.§ Draw the eye where you want it to go
fovea centralisWhen viewing an image from a distance of 60cm (such as on a computer screen at about an arm’s length), our central vision covers and area approximately 2cm wide)
At any one time, our central vision can only focus on one location. Sensory processes draw the eye to specific features around the graphic. Limited cognitive resources mean that we can process only a fraction of the visual information entering our eyes at any given point in time. The paper explains:If important details are not captured by our attention, they will not be processed by the brain.
Use different shapes and size, as well as colour and motion, to direct visual attention towards bits of the graphic that will do most to help the reader understand, the paper suggests.§ Use visual cues, but be selective
Arrows are the symbolic visual equivalent of pointing gestures, which have a widely-accepted meaning of ‘look here’ and are thought to direct attention automatically.
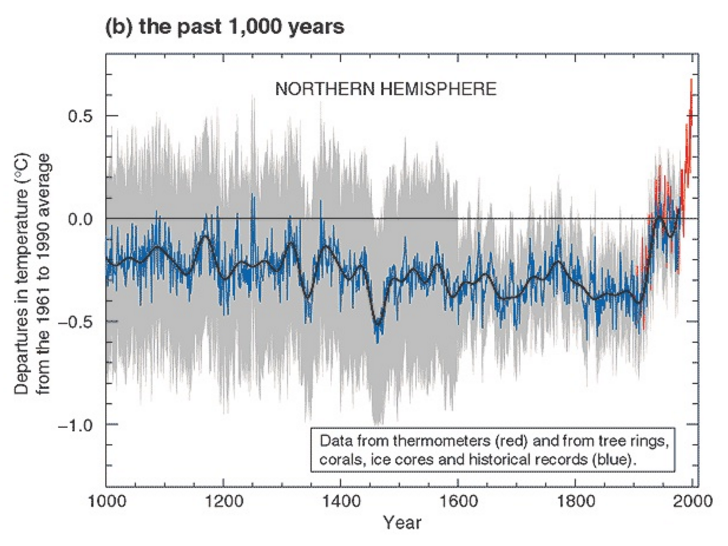
§ Simplify and declutter
hockey stick§ Use familiar concepts
Financial concepts are used metaphorically in speech with regards to limiting carbon emissions, that is, having a carbon budget.
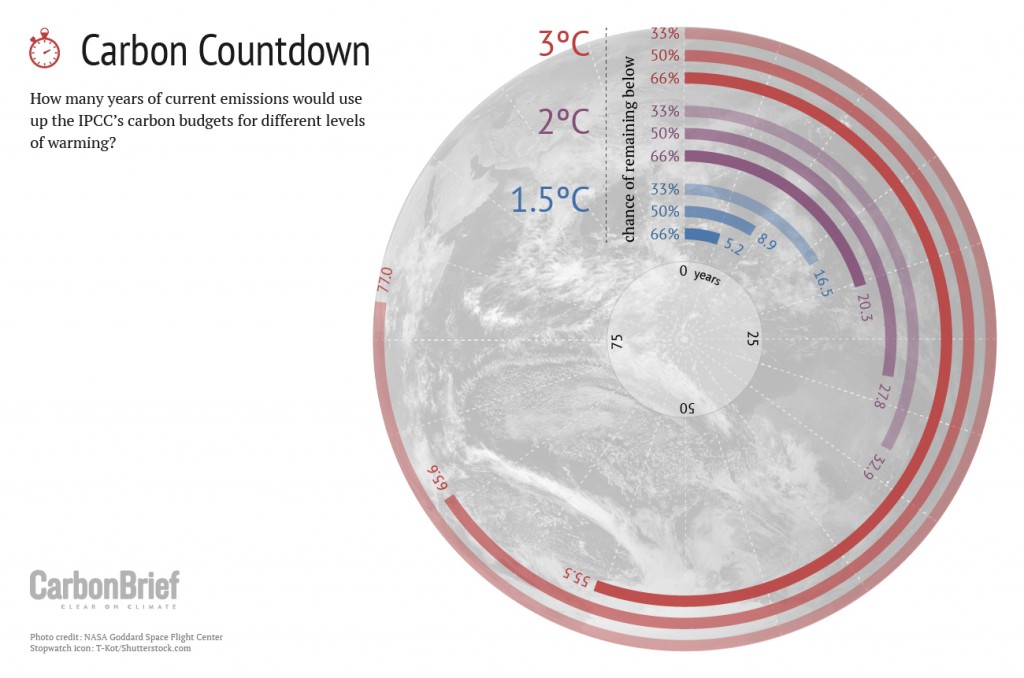
§ Intersperse text and graphics, don’t separate them
Where there is distance between the spatial locations of the text and the corresponding graphic, attention must be split between the two.
§ Don’t make assumptions, always test
For example, some experts, as well as non-experts, show preferences for graphic features that can actually impair comprehension, such as realistic features [and] 3D features.
There’s no substitute for testing, the authors add. While general principles are shared by everyone, specific factors that affect comprehension can differ between audience groups, such as colour-blindness and the native language of the reader. In Arabic, for example, a reader reads text from right to left, so the visual order in the graphic should match, say the authors. The paper says:[These guidelines] provide a useful reference for climate scientists to apply psychological and cognitive insight when creating graphics…However, as individuals and groups can differ, there is no substitute for empirically testing graphics with the target audience.
§ An IPCC case study
IPCC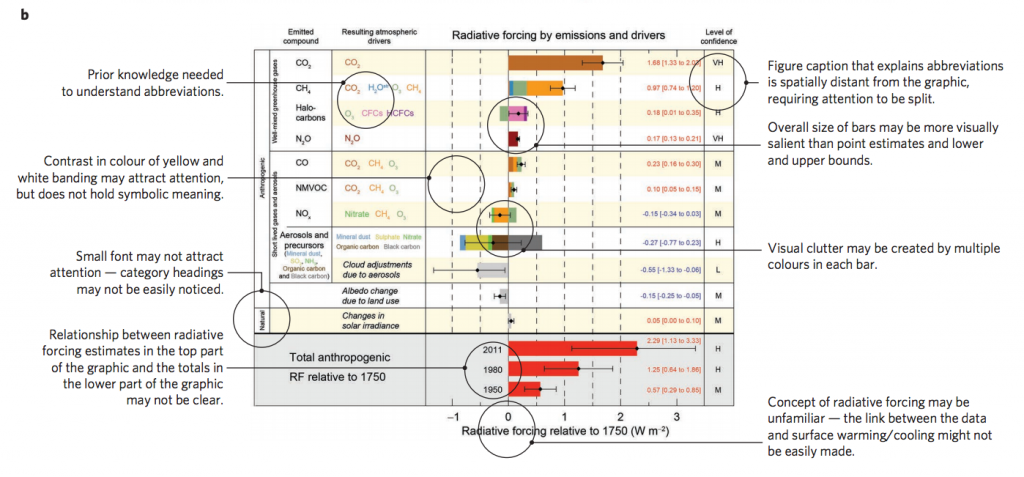
- Gives the meaning of all abbreviations.
- Breaks down information into “chunks” to reduce complexity and clutter.
- Uses larger fonts for headings, relative to other text, to attract attention.
- Uses contrast in colour to distinguish between human and natural factors.
- Integrates the caption text within the graphic to reduce the need for splitting attention.
- Uses colour as a metaphor to support understanding of the link between the data and surface warming or cooling.
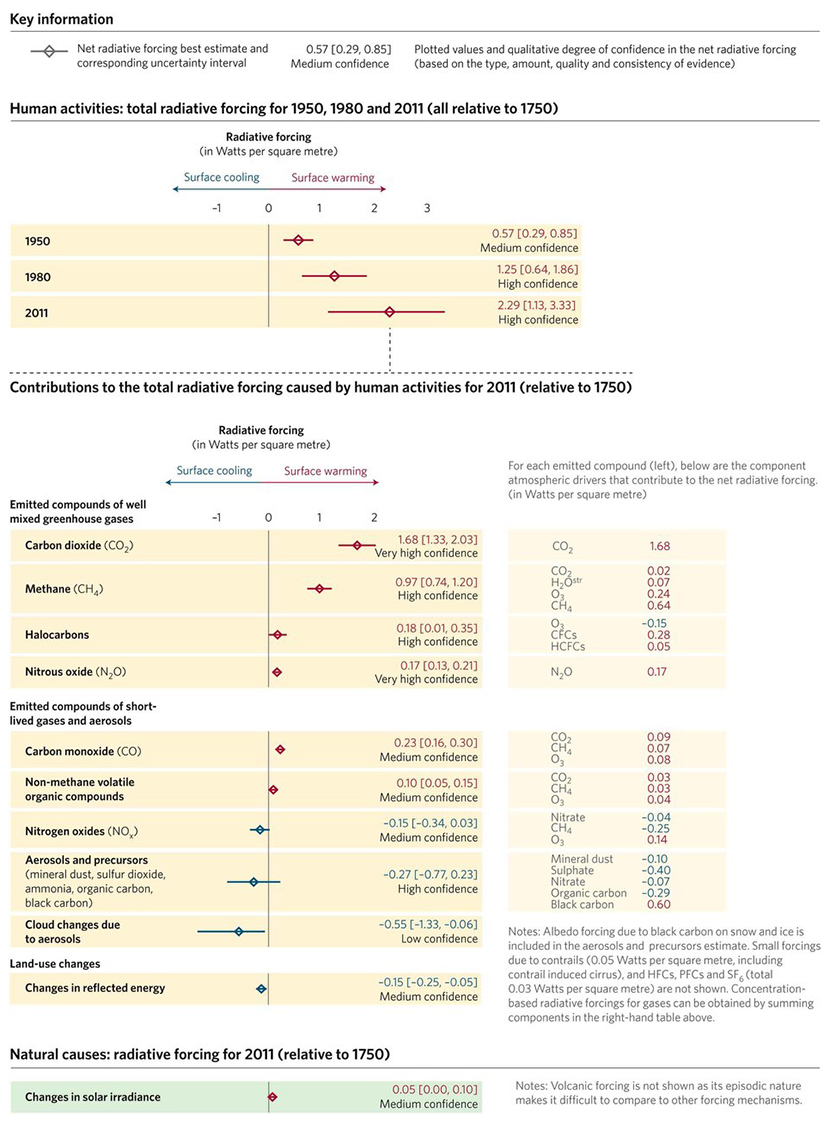
This goal in particular aligns with the IPCC’s desire to make outputs of future reports more accessible and user-friendly to diverse audiences.
two-day meetingArticle information
Harold, J. et al., (2016) Cognitive and psychological science insights to improve climate change data visualization. Nature Climate Change. Doi: 10.1038/nclimate3162