Guest post: Authors respond to misinterpretations of their 1.5C carbon budget paper
This is a guest post written jointly by all the authors of the widely reported – and debated – paper, Millar et al, published in Nature Geoscience last week.Our recent article, “Emission budgets and pathways consistent with limiting warming to 1.5C”, caused a bit of a media storm, so we would like to explain what the article did, and did not, do.§ What did our article do?
Paris Agreement§ What were the conclusions?
see note 1, belowhuman-induced note 2Fifth Assessment Report§ How come?
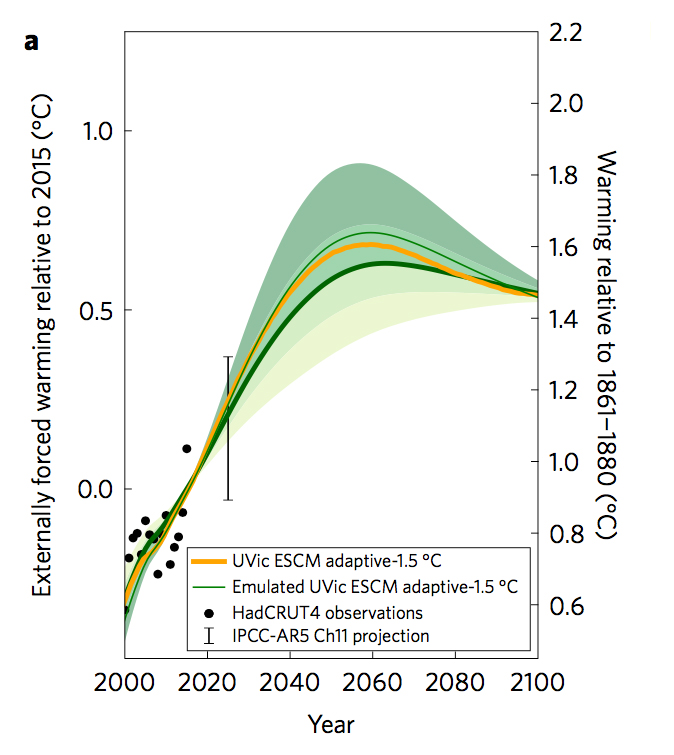
our resulting estimate of projected warming per tonne of CO2 emitted in the future is equally or more in line with other lines of evidence presented by AR5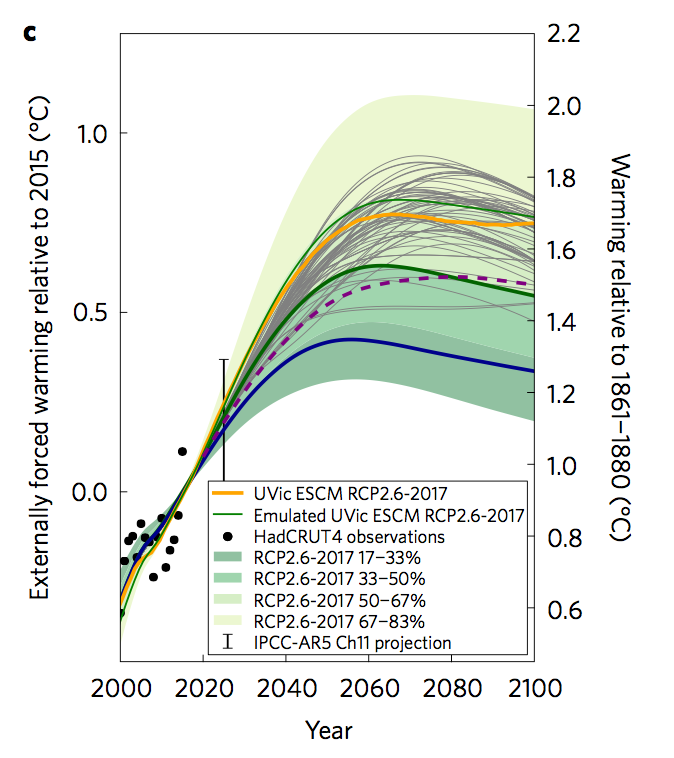
§ There’s been a media storm – have there been big misunderstandings?
note 3CMIP5based on the same set of model simulations used by the authors of AR5already committedis likely to be small§ So what accounts for the difference in estimated carbon budgets?
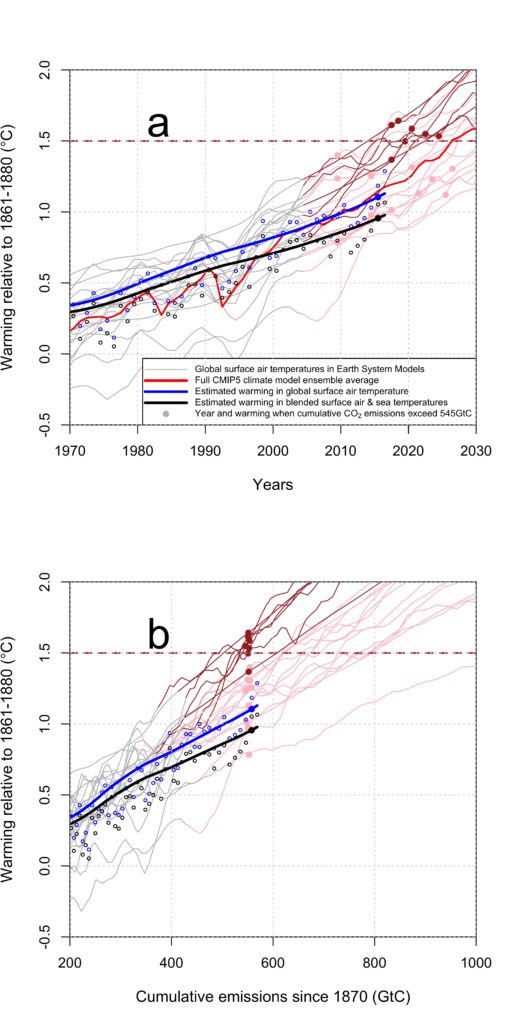
1. Differences between modelled and observed estimates of the current climate/carbon-cycle statea. Mismatches in the dates at which cumulative CO2 emissions reach 545 GtC. In the CMIP5 experiments, models are forced by concentrations, not emissions. To infer emissions, an active carbon cycle is required. Most of the ESMs simulate lower than observed average CO2 emissions over the historical period due to accumulated small differences between observed emissions and emissions as inferred from the models (note 4, below). Most of this occurred before 2000 and does not suggest that the models are systematically over- or under-estimating the fraction of human CO2 emissions that resides in the atmosphere at present. But, as a result, cumulative emissions in about half the models do not reach 545GtC until after 2020, by which time both atmospheric concentrations are significantly above their 2015 values. In models warming at 0.2C per decade, 5 years accounts for 0.1C of warming.
b. Differences between observed non-CO2 drivers of climate change since 2005 and those applied to the models. The CMIP5 models were driven with scenarios for atmospheric composition from 2005. These scenarios differ from the real-world composition for the past decade. It has been shown (for example Medhaug et al, 2017) that use of actual composition would reduce model-simulated warming by 2015 by about 0.1C.
c. Global average surface temperature is defined slightly differently between these models and the observational dataset used in our study. Models use area-average surface air temperature, while the observational datasets used in key figures in AR5 use a blend of observed surface air and seawater surface temperatures where observations exist. Richardson et al (2016) show this can account for a further 0.1C difference between model output and such observational indices.
notOur paper does not argue that the CMIP5 ensemble as a whole, or the subset used for carbon budget calculations, is systematically over-responding to CO2concentration increase2. Treatment of non-CO2 climate drivers3. Definition of “1.5C relative to pre-industrial temperature” note 5Choice of reference period:SPM10Box SPM1Schurer et al, 2017Structured Expert DialogueDefinition of Global Mean Surface Temperature (GMST):HadCRUT4UNFCCC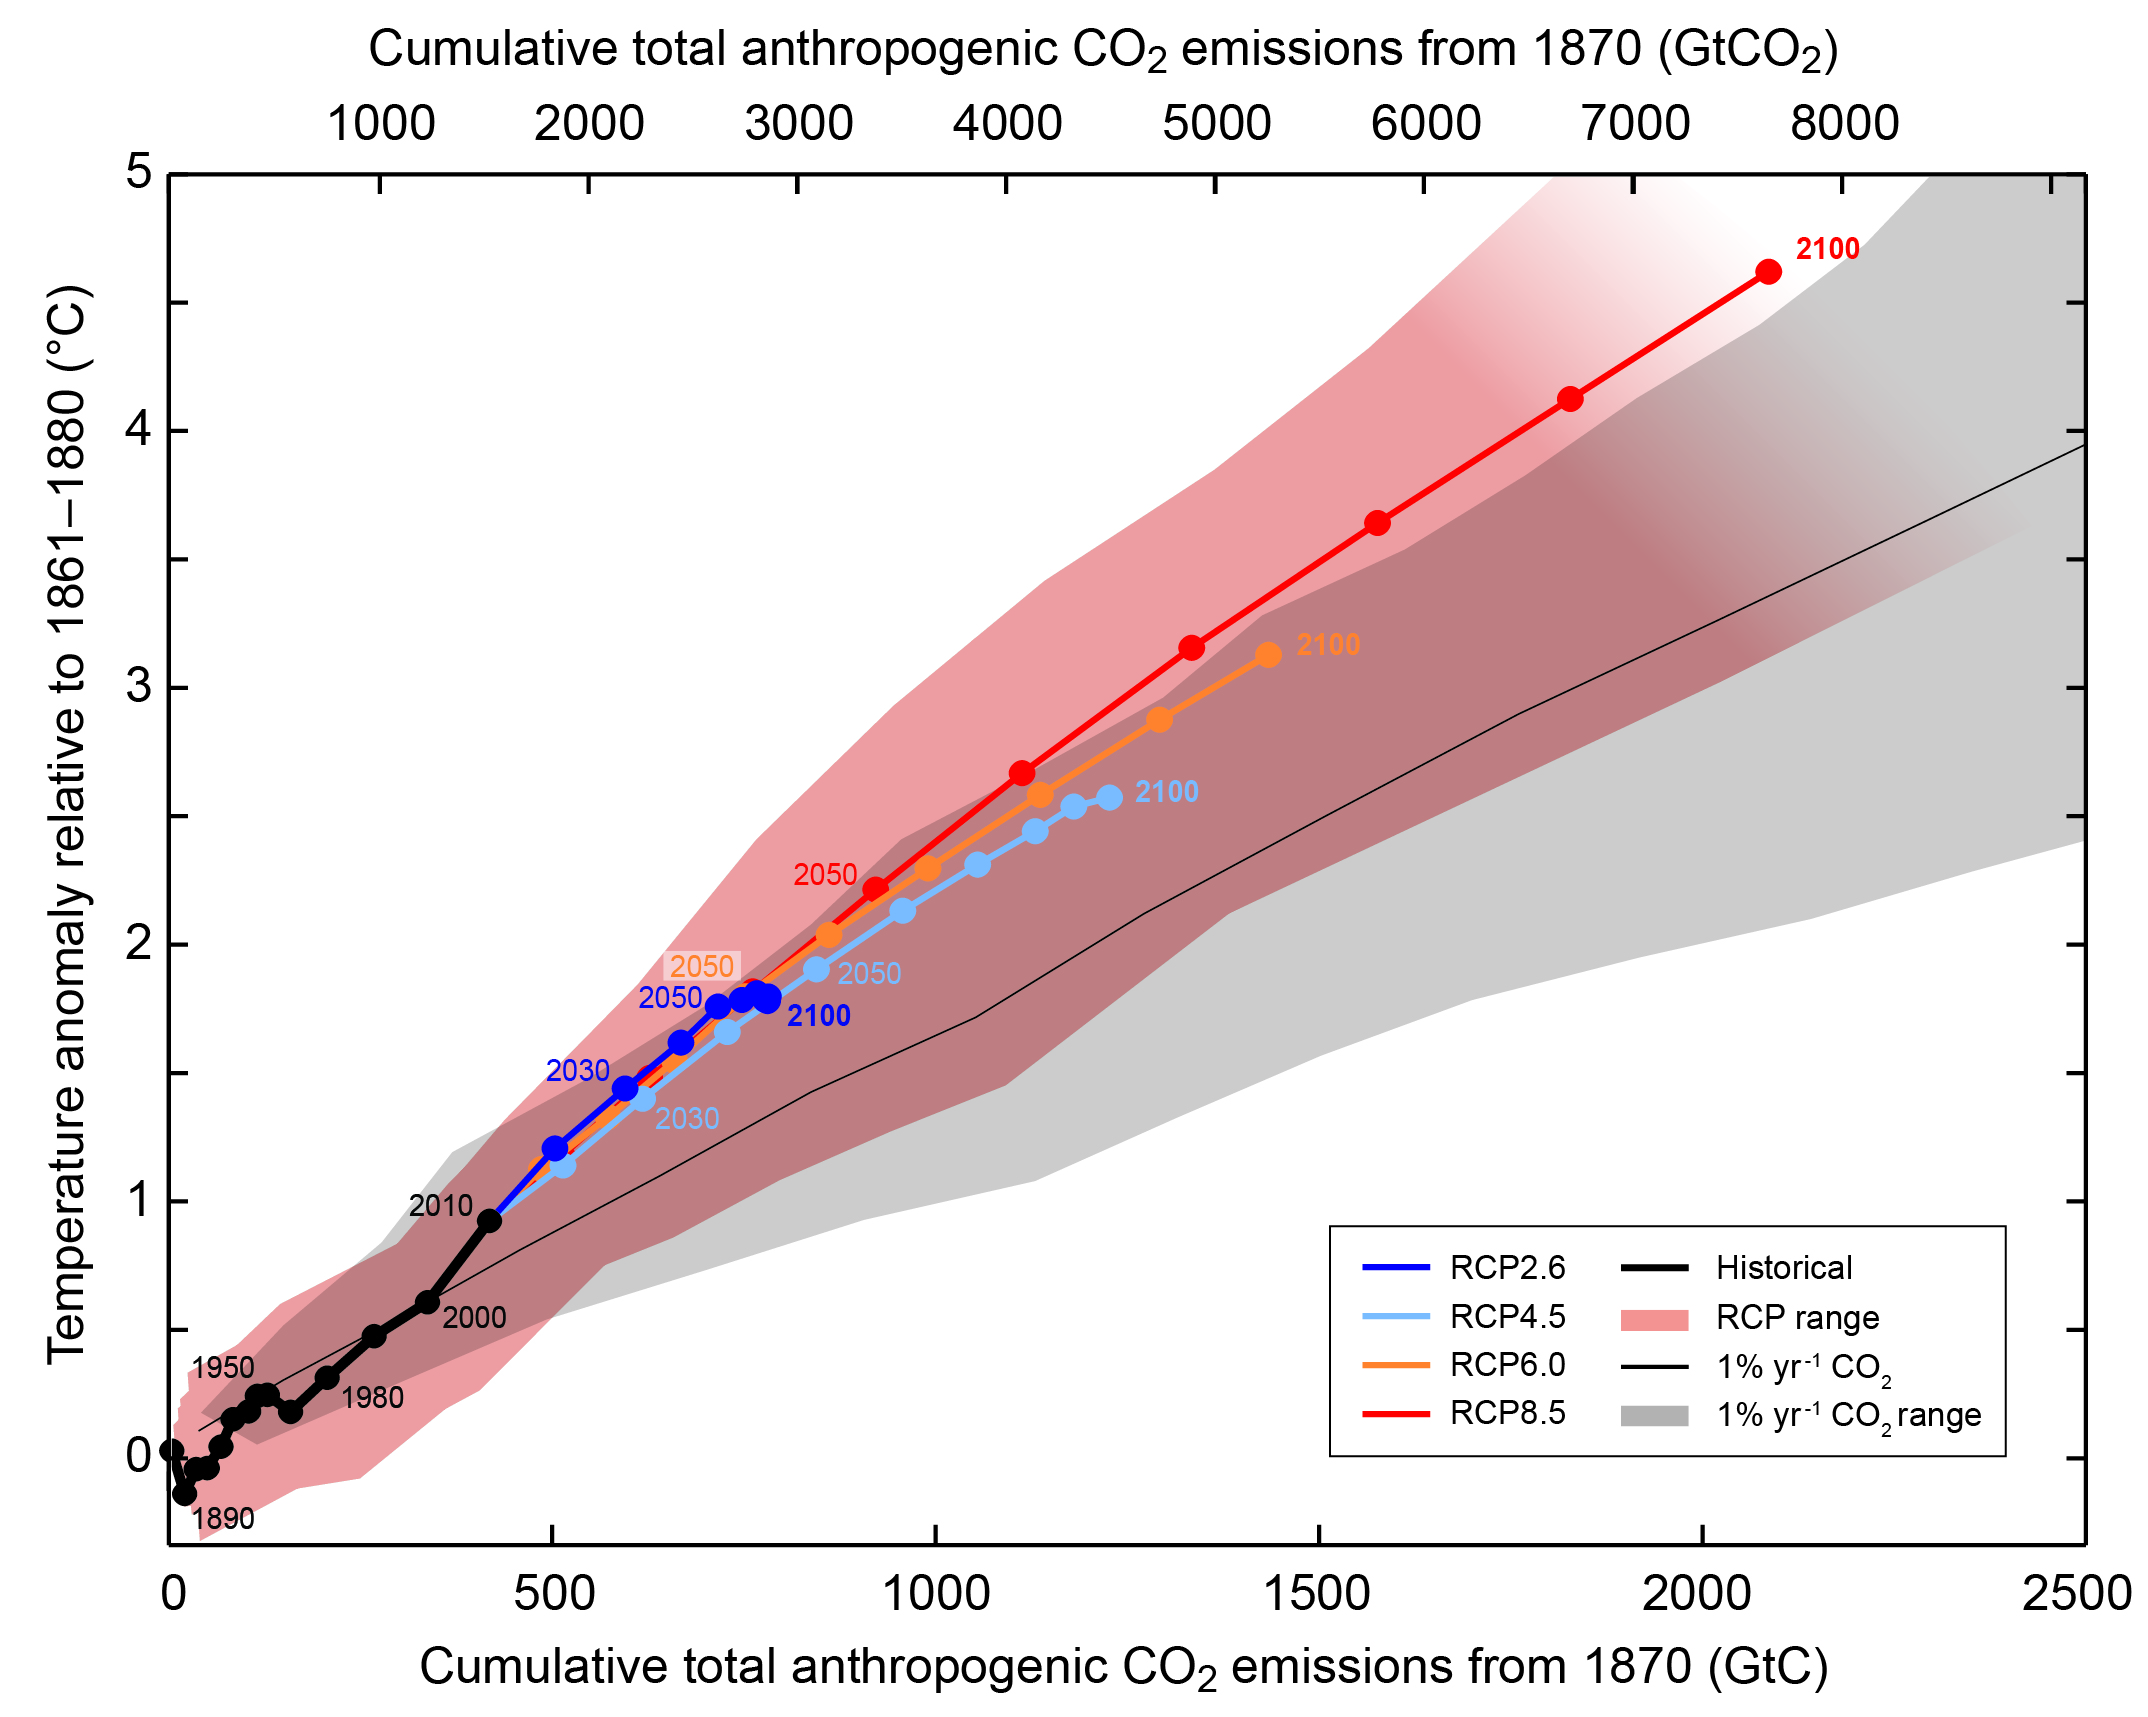
Article information
The authors of this guest post, and the paper, are Richard J Millar, Jan S Fuglestvedt, Pierre Friedlingstein, Joeri Rogelj, Michael J Grubb, H Damon Matthews, Ragnhild B Skeie, Piers M Forster, David J Frame and Myles R Allen.