Guest Post: How IPCC graphics could be made more accessible
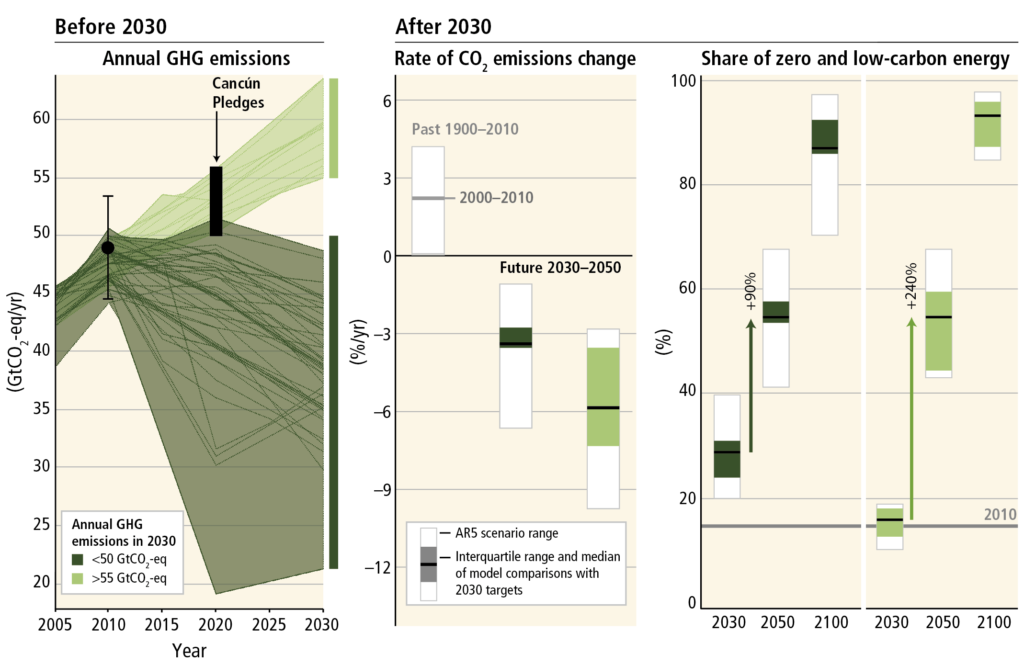
Jordan Harold is an applied cognitive psychologist at the school of psychology, University of East Anglia, and the Tyndall Centre for Climate Change Research.The Intergovernmental Panel on Climate Change (IPCC) is currently calling for nominations for authors of its next assessment report. This will be the sixth such report since the IPCC was established in 1988.While these extensive reports have been criticised as being inaccessible to non-experts, IPCC chair Dr Hoesung Lee recently outlined a commitment (pdf) that the next set will be “clear, accessible and user-friendly…so that non-specialists can understand climate change and its implications”.This commitment feeds into growing momentum within the IPCC and the broader climate change research community to make scientific knowledge about climate change more accessible to wider audiences.There have already been positive efforts to improve the communication of the text of IPCC reports, for example, by the use of headline statements and frequently asked questions (pdf). However, it is less clear how the graphics – such as graphs, charts and diagrams – might be made more accessible.Research suggests that highly educated audiences can sometimes struggle to interpret IPCC figures correctly. Yet merely simplifying the content comes with the risk of losing the scientific rigour that the IPCC’s credibility depends on.Recognising this issue, the Norwegian Environment Agency invited my colleagues and me at the University of East Anglia and the Tyndall Centre for Climate Change Research to develop practical guidelines for researchers.In line with current evidence, published by myself and colleagues in Nature Climate Change, our guidelines highlight that the success of a visual depends on the message being communicated, the prior knowledge and expectations of the audience, and the perceptual features of the visual design. In addition, success can only be known if measured and data visuals, therefore, ideally need to be tested with their intended audience to evaluate their effectiveness and identify any difficulties in comprehension.These elements, encapsulated in the guidelines by the ”MADE” principle – Message, Audience, Design, Evaluation – can be considered as four key pillars in evidence-based communications design.Using the MADE principle, our report aims to equip researchers, both within the IPCC and researchers more broadly, with a set of guidelines to help make graphics more accessible. In addition, we provide recommendations for consideration by the IPCC Bureau and Technical Support Units that could help make authors’ lives easier.Below, I look at each pillar of the MADE principle in turn.§ Message: Communicate it clearly
§ Audience: Understand who you are communicating with
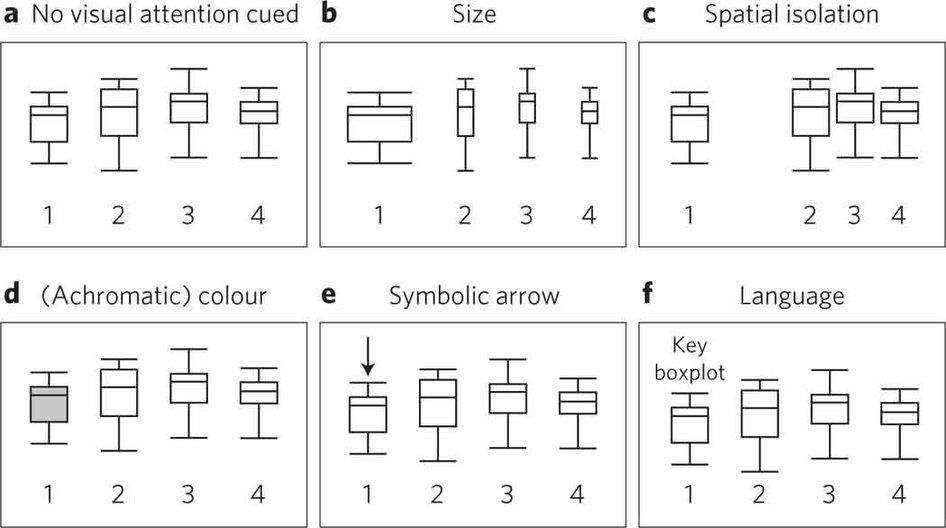
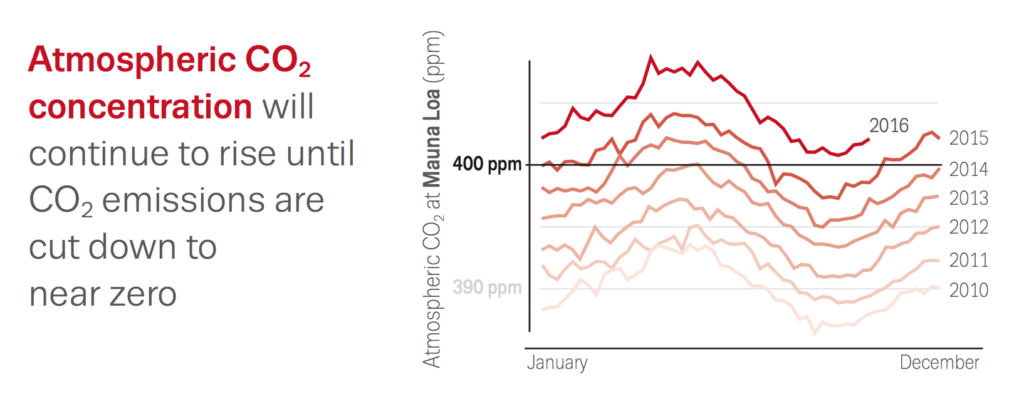
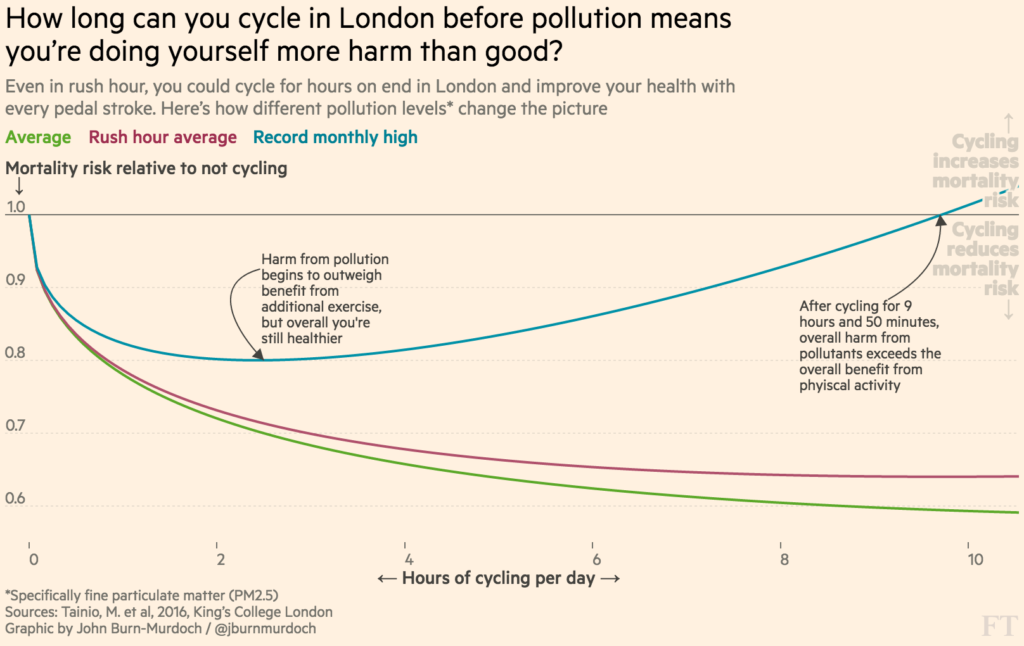
policymakerscurse of knowledgeincludes psychologists§ Design: Draw on cognitive science
useful landmarks
§ Evaluation: Test and get feedback
§ Improving IPCC graphics
special report on global warming of 1.5Cscience of science communicationactively engagingIPCC Expert Meeting on Communication demanding processArticle information
Harold, J., Lorenzoni, I., Coventry, K. R., and Minns, A. (2017) Enhancing the accessibility of climate change data visuals: Recommendations to the IPCC and guidance for researchers. Report published by the Tyndall Centre for Climate Change Research, Norwich, UK.
Report website: guidance.climatesciencecognition.com
Report summary: tyndall.ac.uk/datavisuals