Mapped: How global warming and land-use change threaten water security worldwide
The world’s water supply has been severely altered by global warming and changes to land use – such as agriculture and damming – over the past 15 years, new satellite data shows.The Nature study of 32 world regions finds that the largest freshwater losses are occurring across the Middle East, India, Antarctica and Greenland. In contrast, the largest gains are taking place in parts of Asia, North America and South America.From 2002 to 2016, Greenland lost an average of 279m tonnes of freshwater a year – which is almost 10 times the amount of the water stored in Lake Mead, the world’s largest manmade reservoir. The reservoir was formed between Nevada and Arizona by the construction in the 1930s of the Hoover Dam.The findings show that there is now a “clear human fingerprint” on the global water supply, the researchers say. However, natural variability also played a role in driving changes to water availability over the study period, they add.§ Grace period
threaten water securityrainfall patternsglaciers and ice sheets800 millionGRACEabove the planet
§ Global view
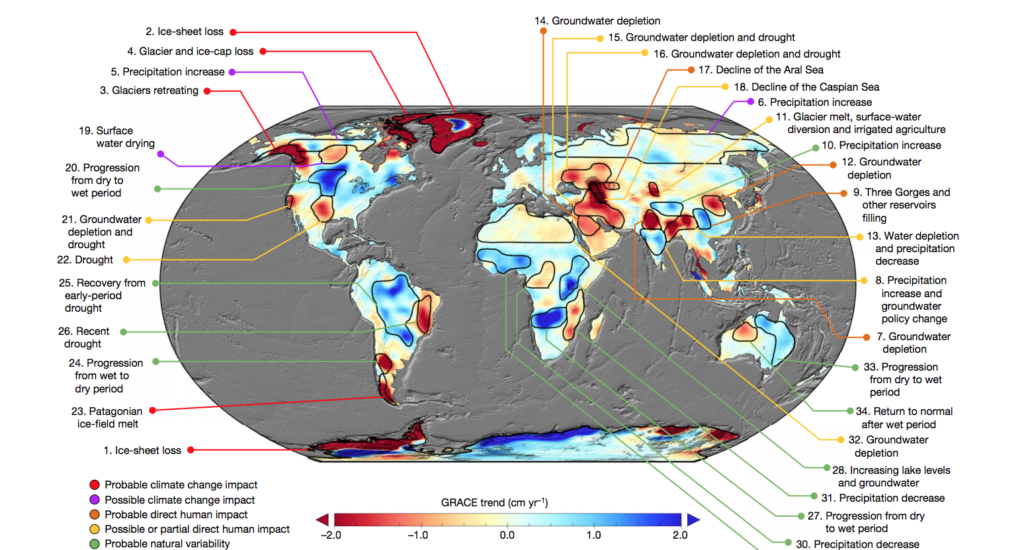
“[We] quantify and explain 34 prominent trends in freshwater storage around the world. Of those, eight were associated with climate change and 14 were associated with human activities like groundwater pumping. Only 12 were caused by natural variability alone.”
§ Falling water
recent severe droughts§ Wet spots

“It will take at least another 15 years to attribute the apparent trend to climate change with any certainty. More flooding is a possibility, but these are sparsely populated regions for the most part.”
“When precipitation is above normal for an extended period of time in a particular region, that region’s aquifers, soils, and surface waters are replenished. The reverse is also true.
“In a 14-year record, if you have a wet period in the beginning and a dry period at the end, it will look like a negative trend – for example in eastern Brazil – and a dry period followed by a wet period will look like a positive trend, for example in eastern Australia.”
Prof Kevin TrenberthNCAR“The biggest source of variability is the El Niño phenomenon. Typically during an El Niño event the ocean is especially warm over the Pacific and the rains tend to preferentially occur there, including hurricanes and typhoons. In 2011 to 2012, there was major flooding in many places: especially Australia – where Lake Eyre filled up – and also in upper Mississippi and parts of Siberia.”
§ Human fingerprint
“A…characteristic of the map is that it reveals a clear ‘human fingerprint’ on the global water cycle.”
“The main message is that freshwater availability is changing around the world due to both climate change and direct human impacts, and it is imperative that we continue to monitor it carefully so that decision-makers can enact the appropriate policies for conserving water resources and preventing future catastrophes.”
Article information
Rodell, M. et al. (2018) Emerging trends in global freshwater availability, Nature, doi.org/10.1038/s41586-018-0123-1