Guest post: Ten charts show how the world is progressing on clean energy
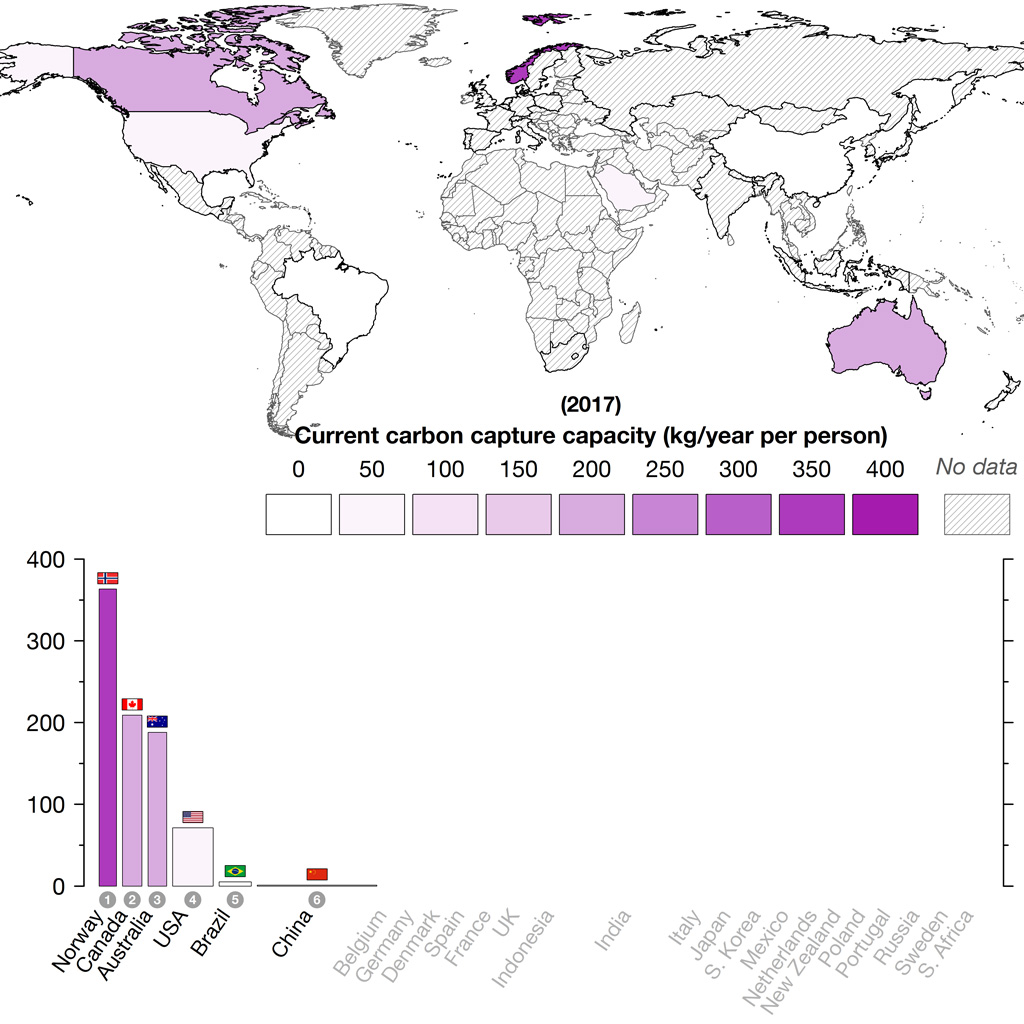
Dr Iain Staffell is a senior lecturer in sustainable energy at Imperial College London’s Centre for Environmental Policy. He leads the Electric Insights project reporting interactive real-time and quarterly summary information on the UK’s electricity mix.Rapid progress towards clean energy is needed to meet the global ambition to limit warming to no more than 1.5C above pre-industrial temperatures.But how are countries doing so far? In our Energy Revolution Global Outlook report, written with colleagues at Imperial College London and E4tech – and published by Drax – we rank progress in 25 major world economies.Our report provides a league table of their efforts to clean up electricity generation, switch from oil to electric vehicles, deploy carbon capture and storage, eliminate fossil fuel subsidies and tackle energy efficiency.The ten charts below compare these 25 countries today and their progress over the last decade.§ Progress on clean electricity
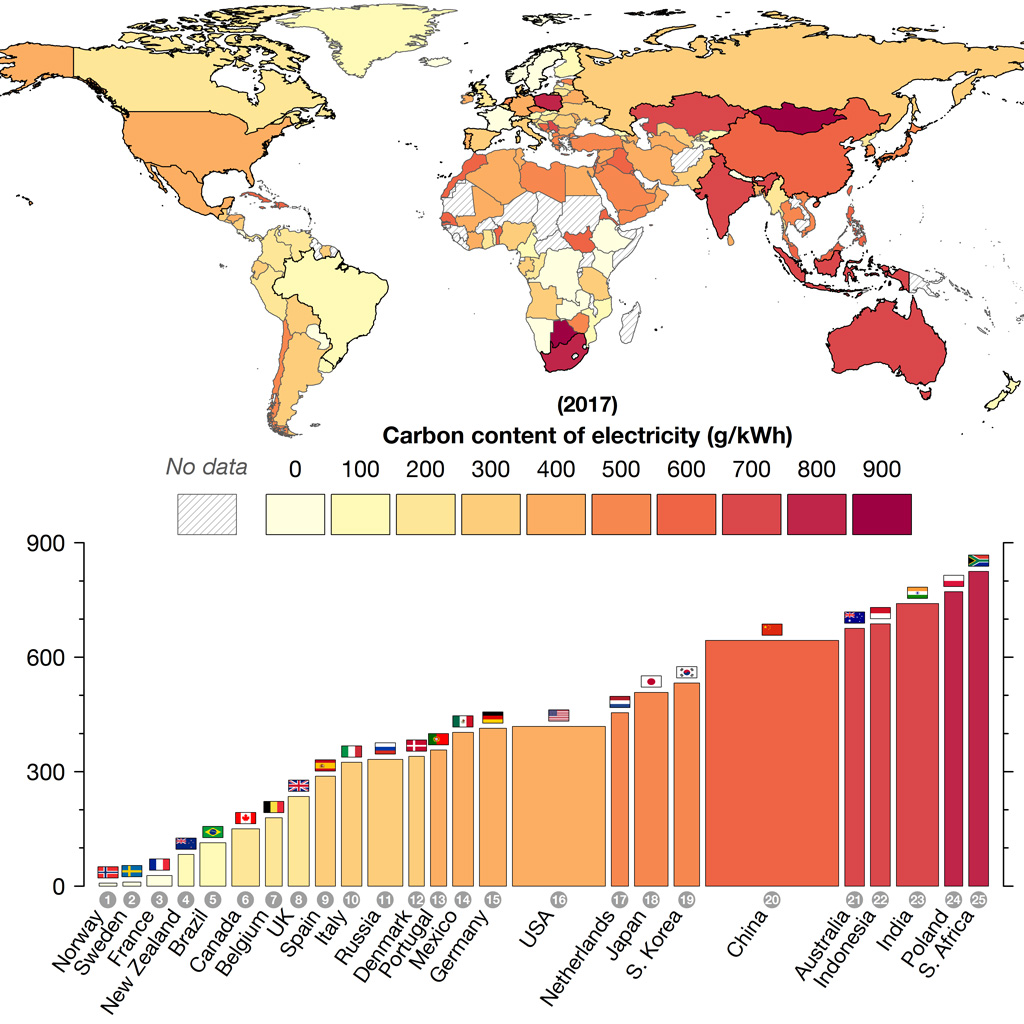
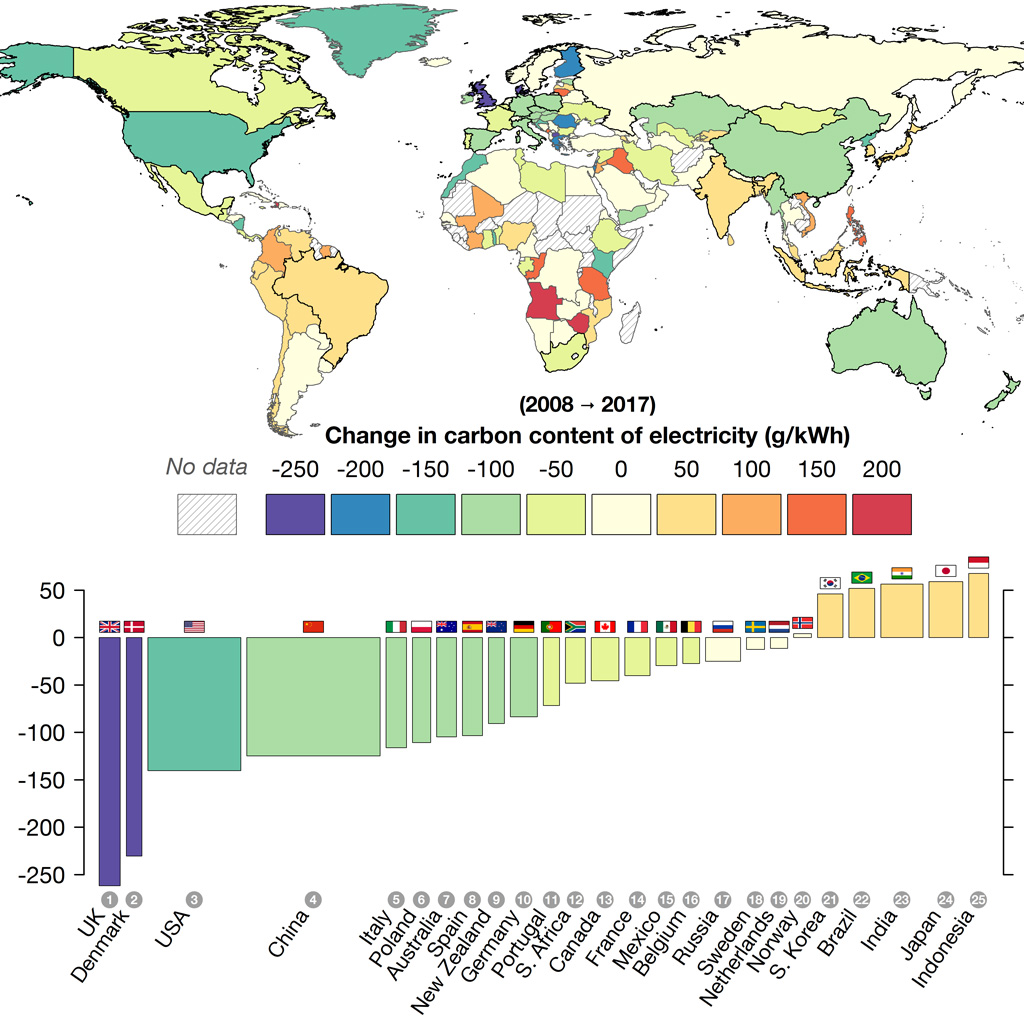
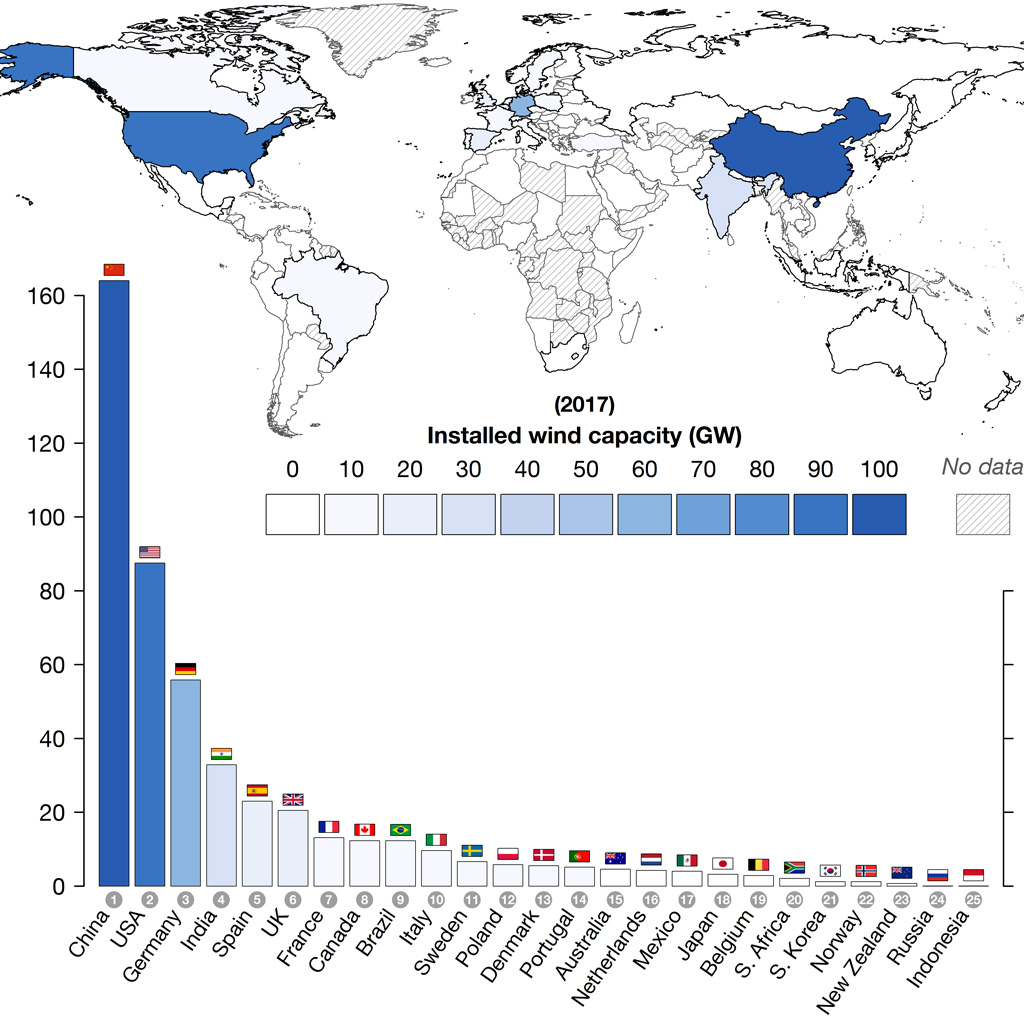
§ Progress on clean transport
rapidly coming downseveral countries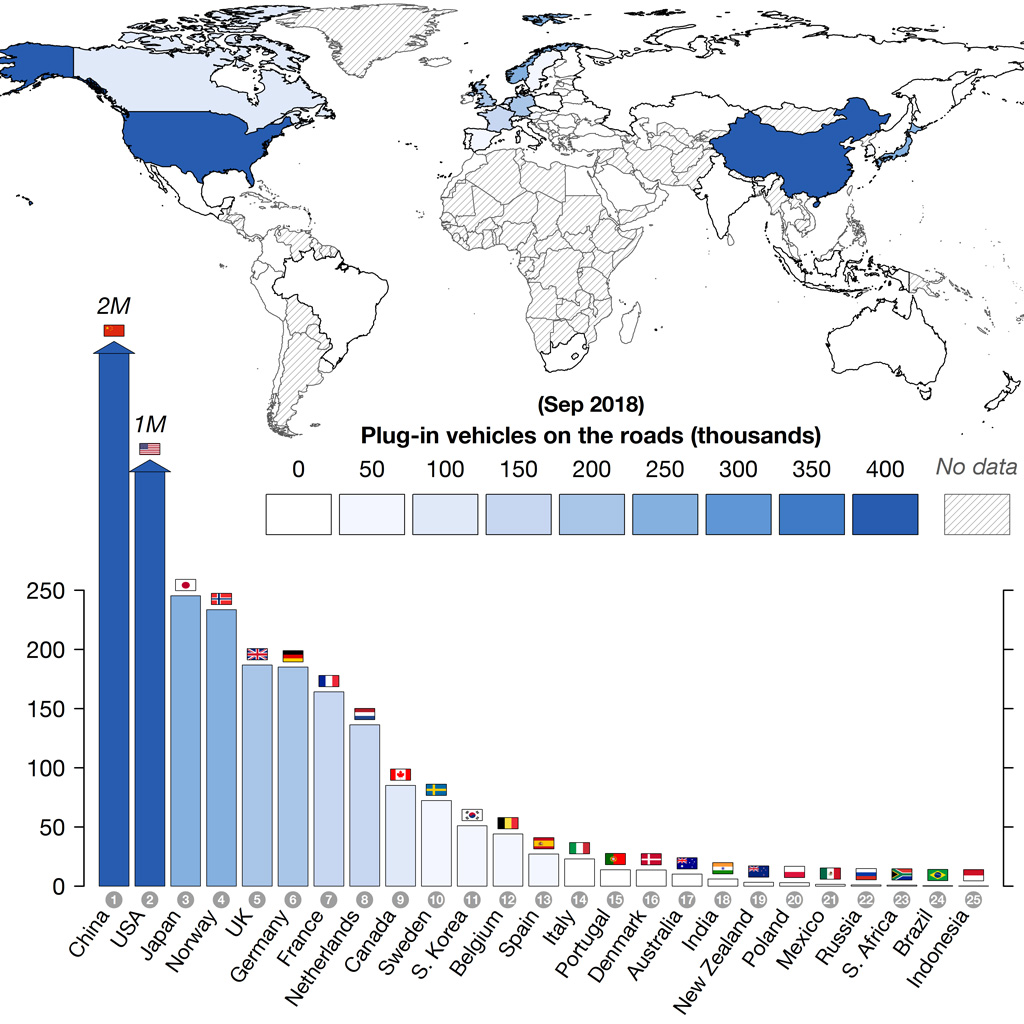
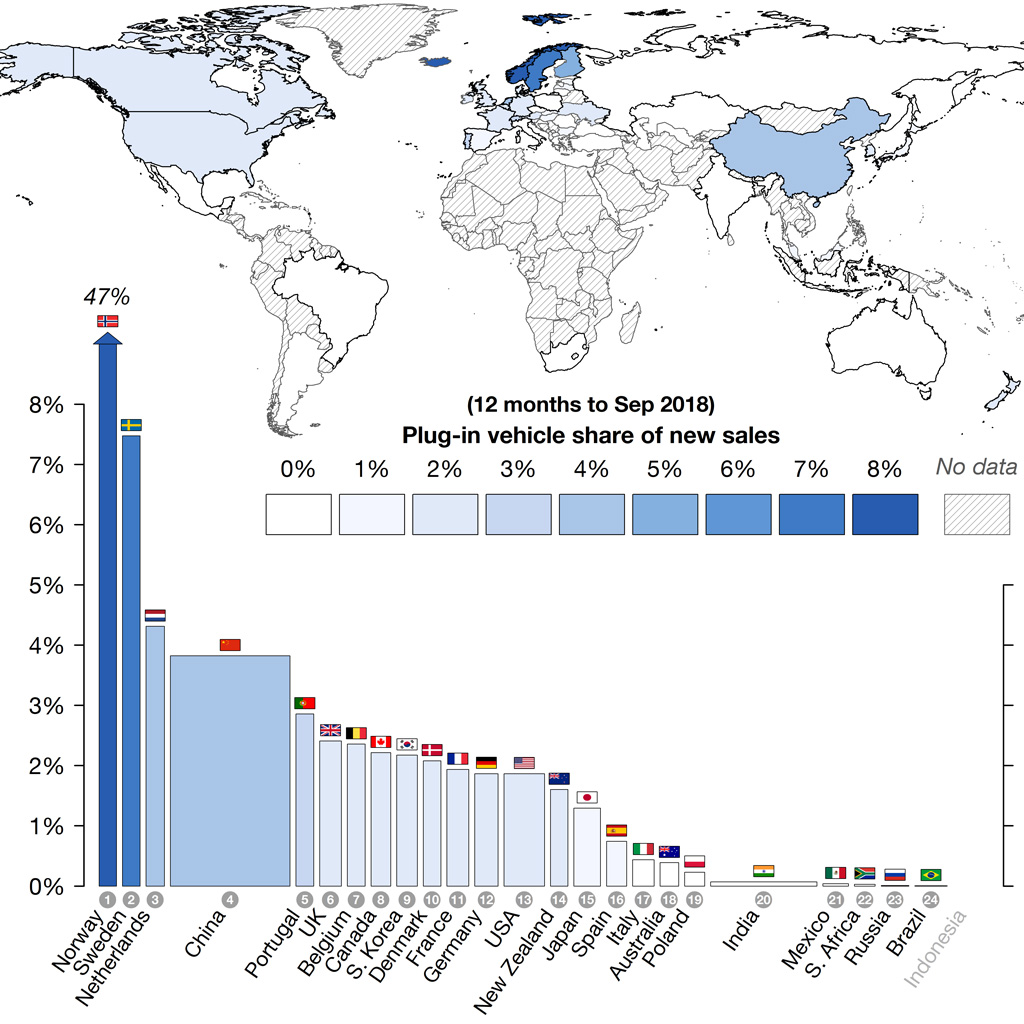
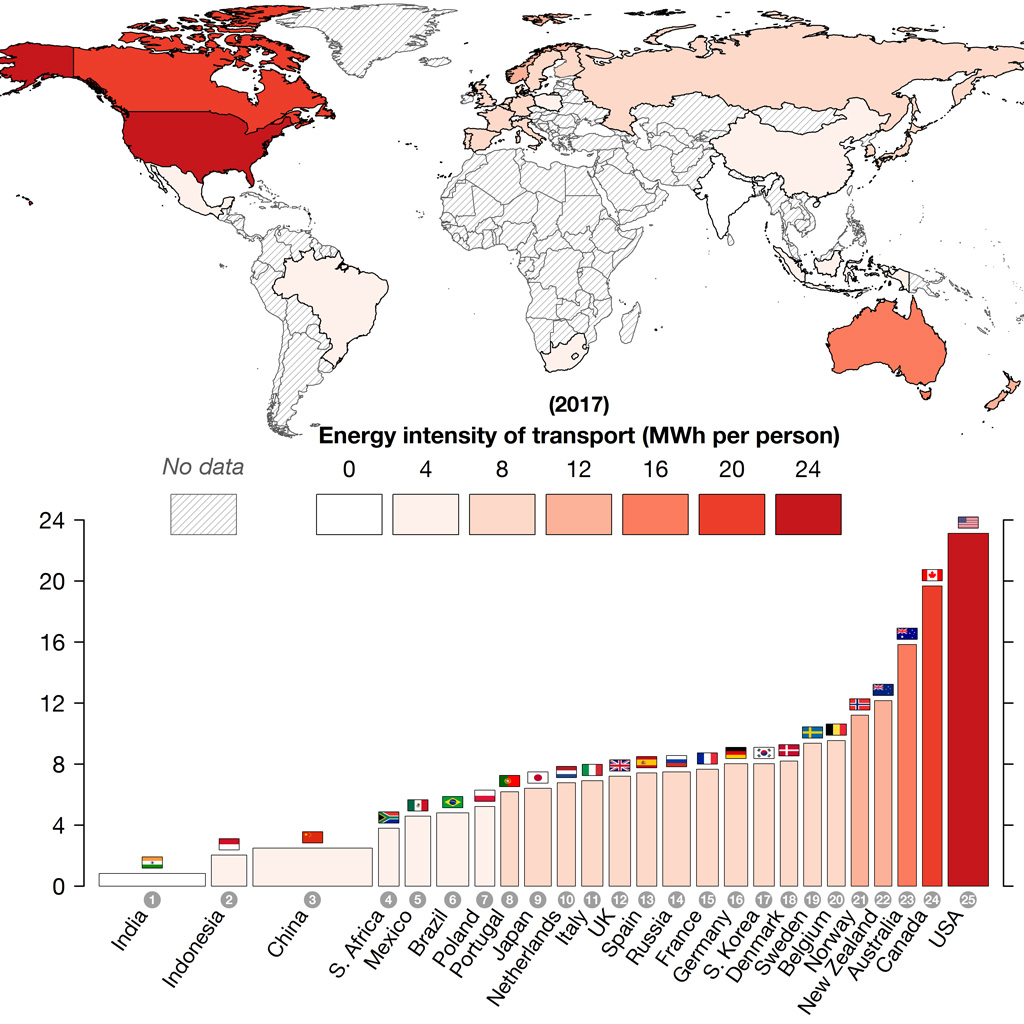
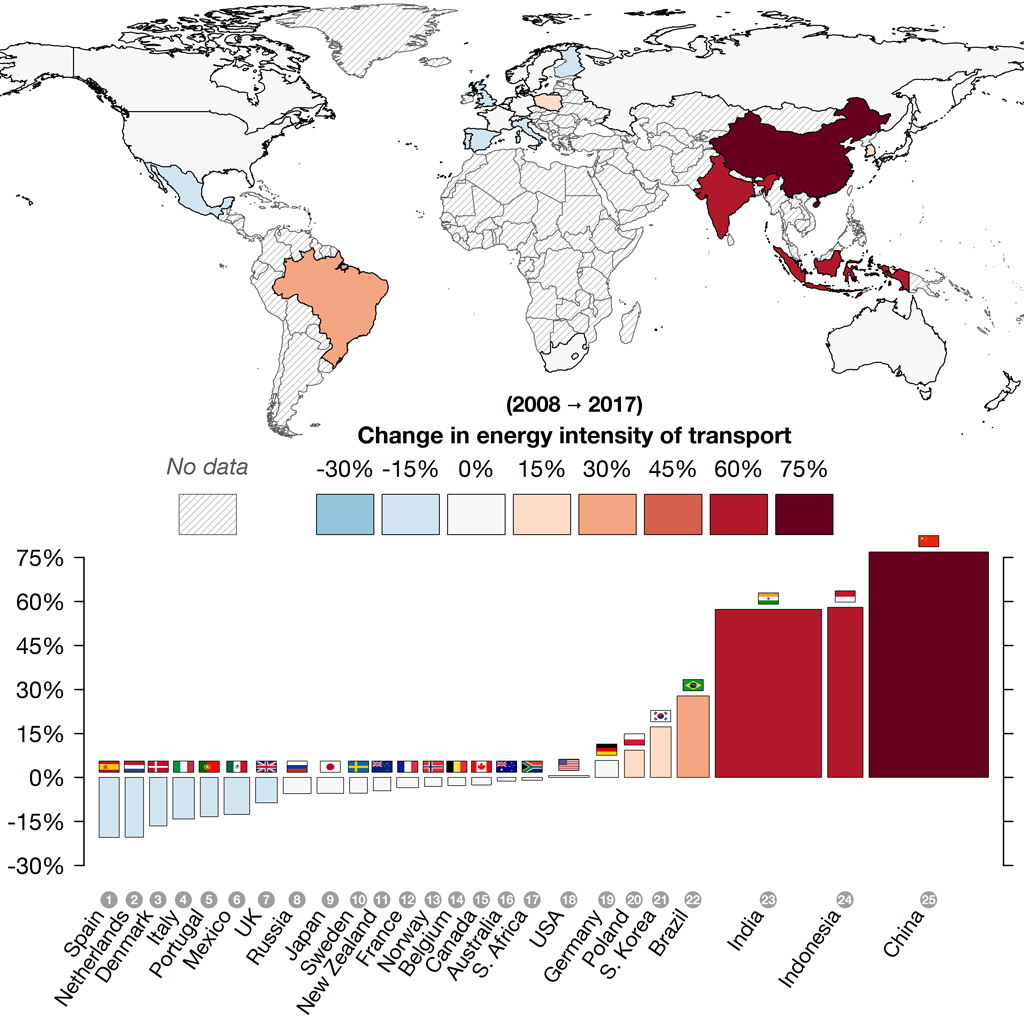
§ Progress on energy efficiency
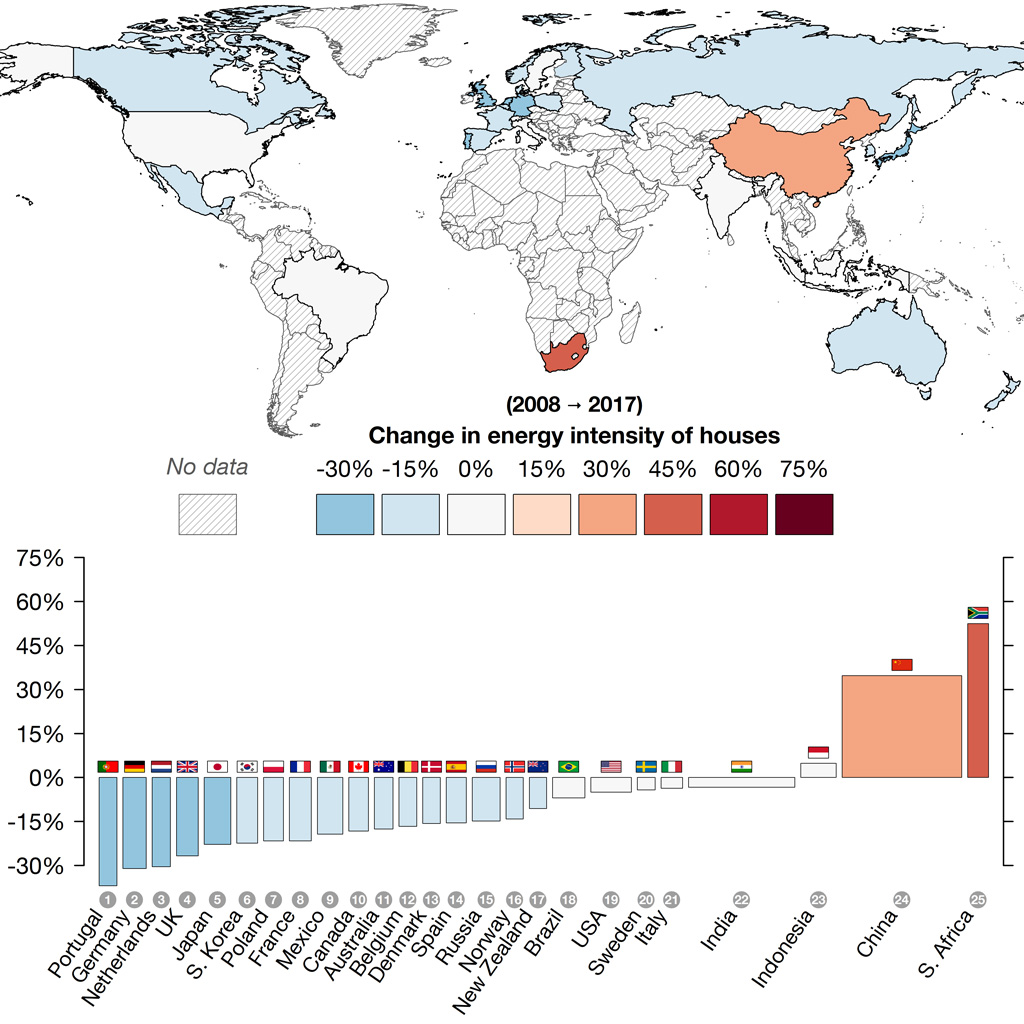
§ Progress on fossil fuels and carbon capture
widely disputedOECD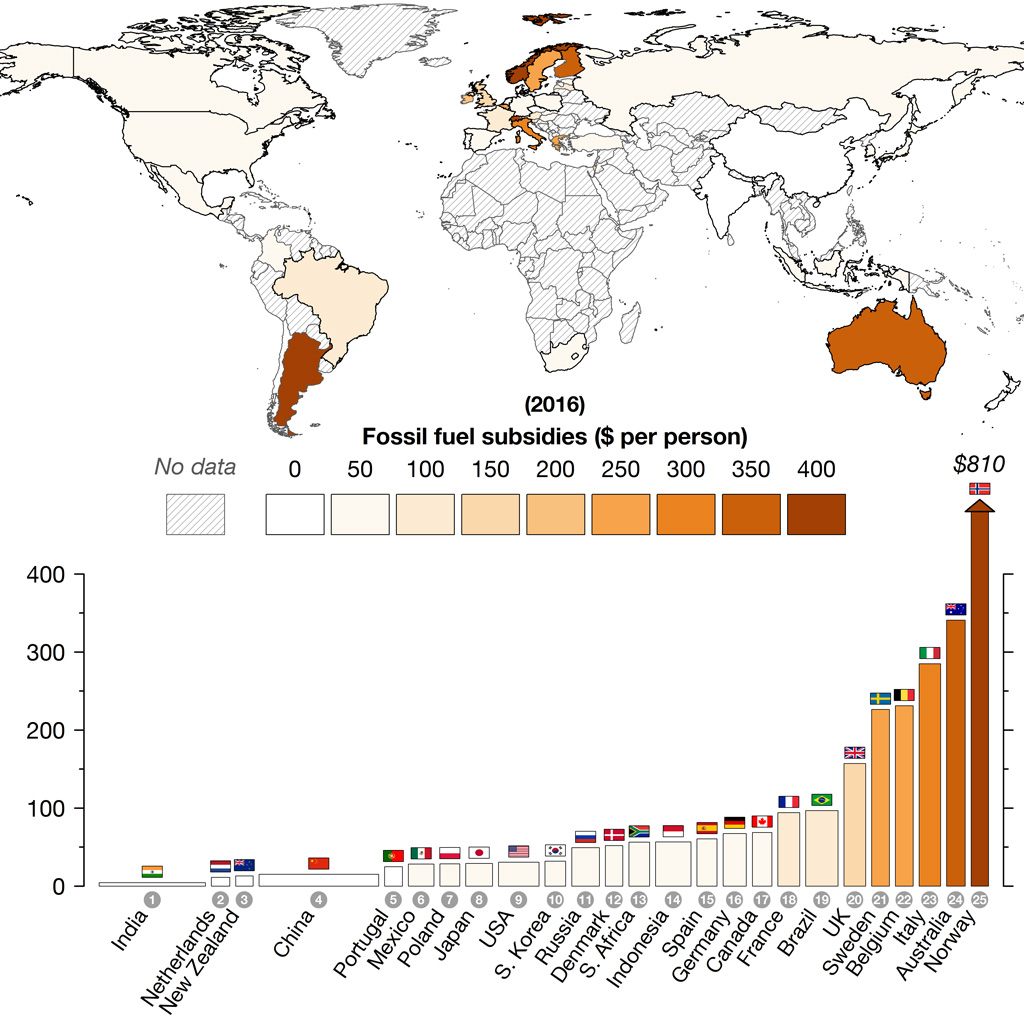
§ Conclusion
Article information
I. Staffell, M. Jansen, A. Chase, E. Cotton and C. Lewis (2018). Energy Revolution: Global Outlook. Drax: Selby.
Charts produced by Iain Staffell using R with data from the IEA, BP, Wilson and Staffell (2018), IRENA, EV-volumes, OECD, and GCCSI.