The Carbon Brief Profile: India
In the fifth article of a series explaining how large emitters are positioned to tackle climate change, Carbon Brief sets out India’s key policy developments, pledges and statistics…India is the world’s third largest emitter of greenhouse gases (GHGs), after China and the US.[contentbox id=”29536″]Coal power plants, rice paddies and cattle are major sources of emissions, which continue to rise steeply, although per-capita emissions remain well below the global average.India is also very vulnerable to climate change, notably due to the melting of the Himalayan glaciers and changes to the monsoon.The country has pledged a 33-35% reduction in the “emissions intensity” of its economy by 2030, compared to 2005 levels.It is holding a general election this year throughout April and May, with polls projecting a minority win for current prime minister, Narendra Modi.(Update 24/05/2019: After a lengthy election process, the BJP under Modi – who has often emphasised the importance of tackling climate change – secured a decisive victory towards the end of May. More than 600 million people voted of the 900 million who were eligible to take part in the largest election that has ever taken place.)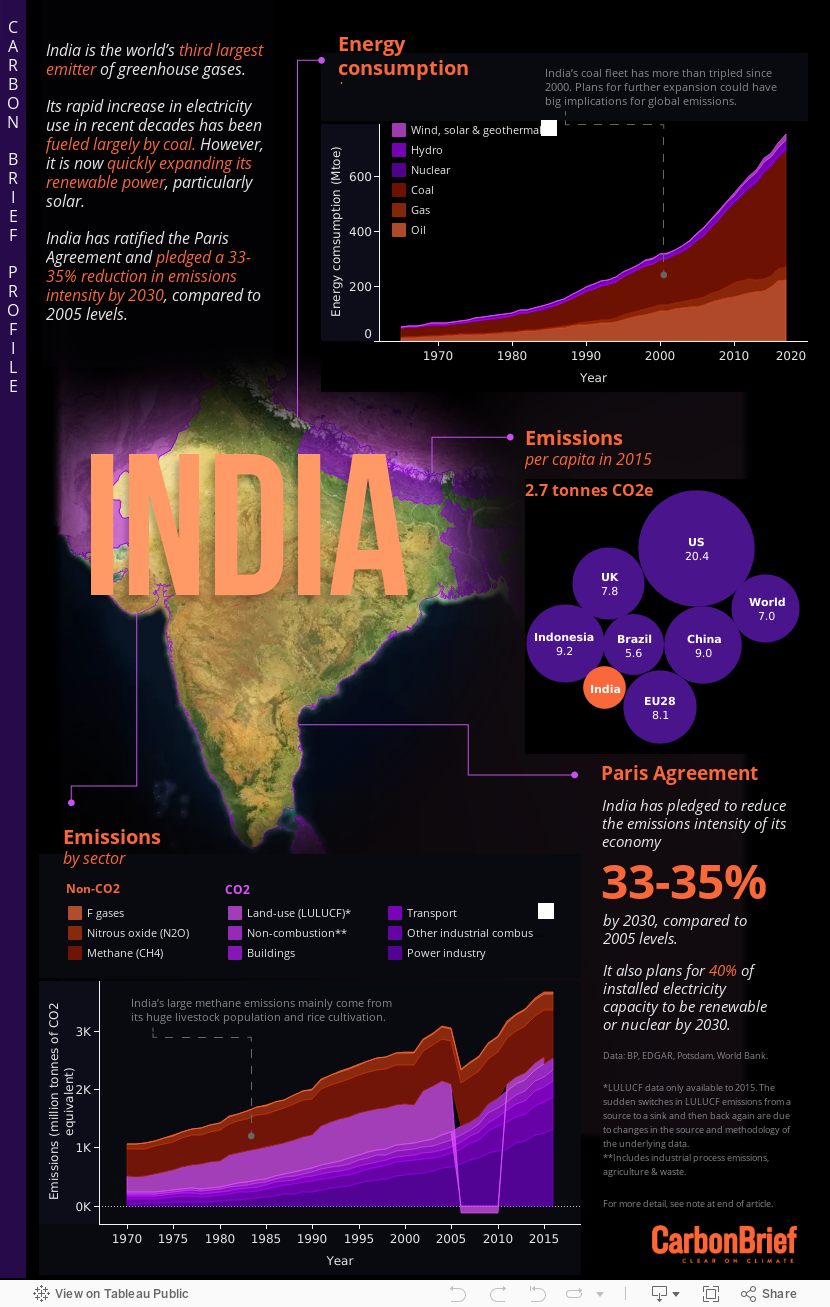
§ Politics
1.3 billionsixthGDPfastest growingexpectedfirst won officeBharatiya Janata PartyIndian National Congresstoldon900 million peoplehugely complexopinion pollsRahul Gandhi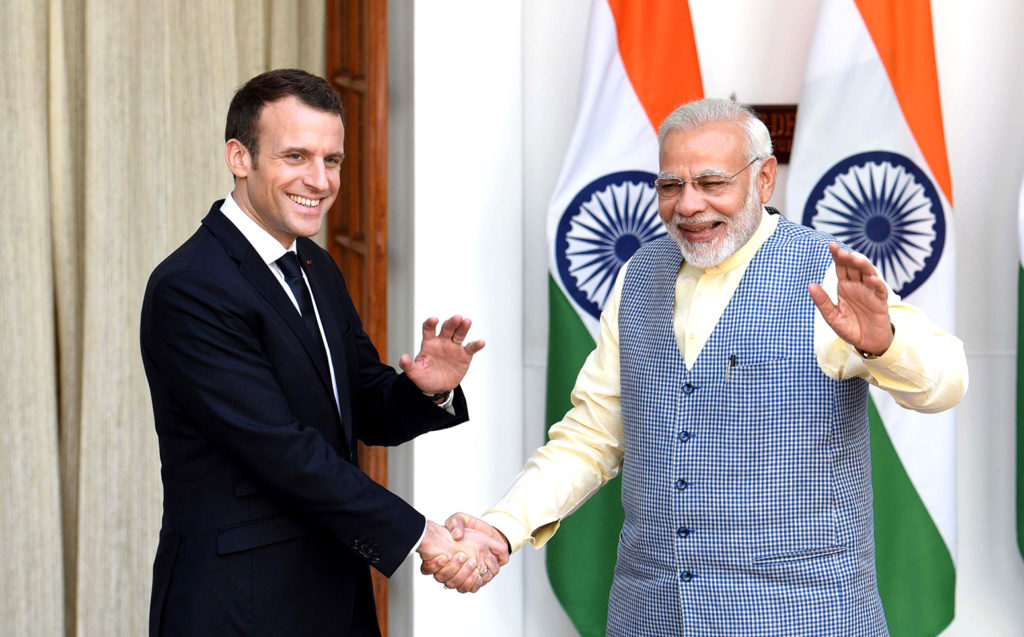
§ Paris pledge
negotiating blocsBASICLMDCG77 + ChinaCfRNdatacompiledPotsdam Institute for Climate Impact Researchstood atratifiedclimate pledgeNDCParis climate talksemissions intensityanalysis
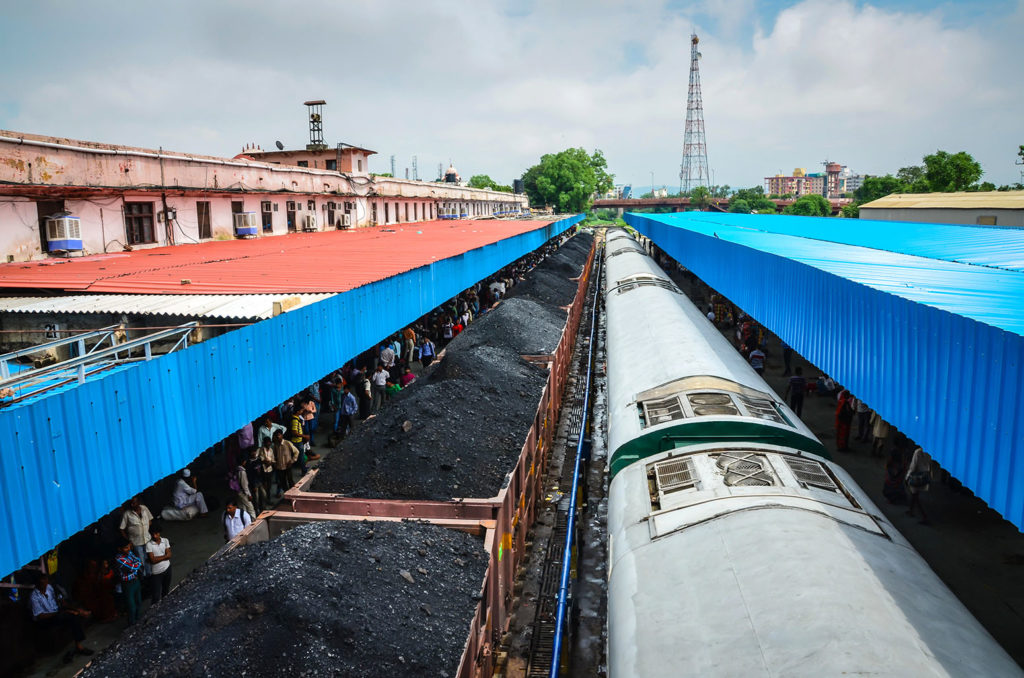
§ Coal
second largestplateauedexpectpeak in 2014more than tripled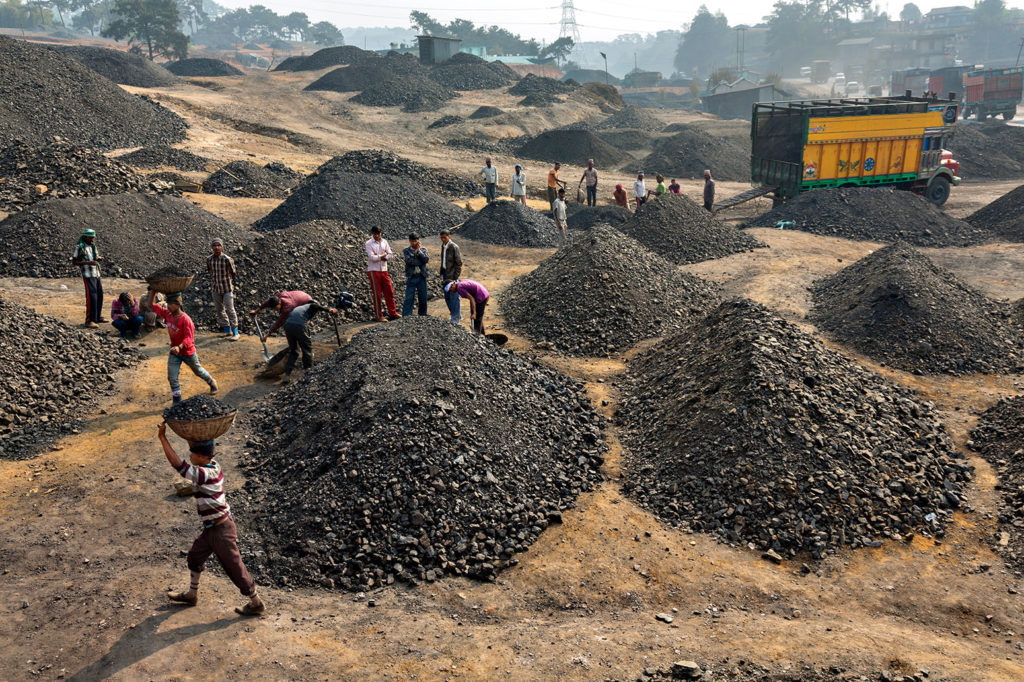
§ Low-carbon energy
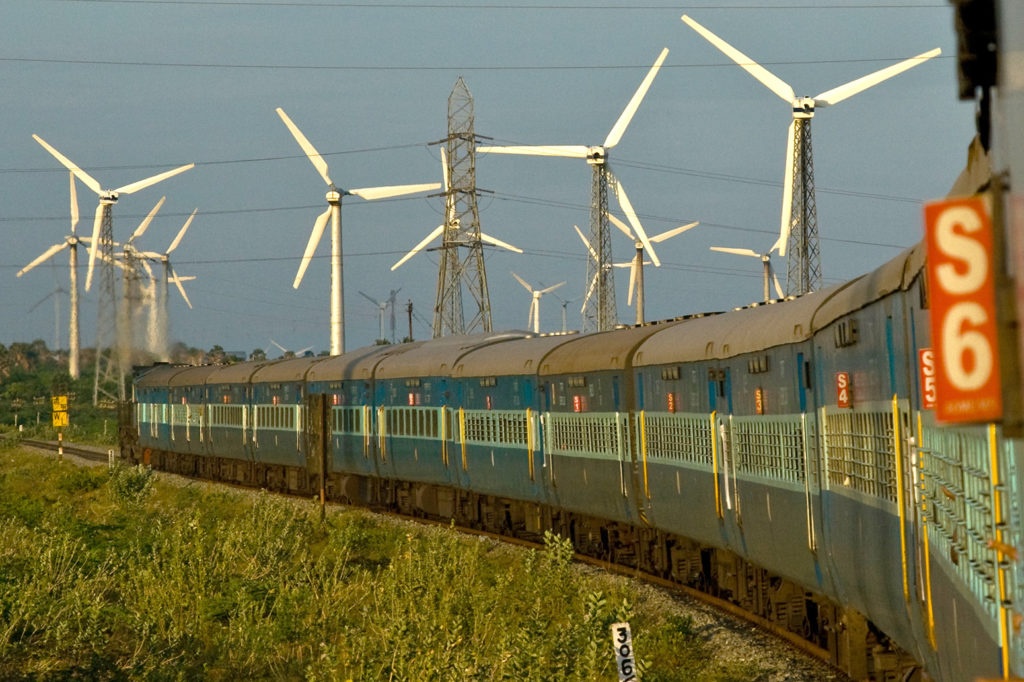
notableinvestmentnew capacityonlyRapidly fallingfalling out of favourneeded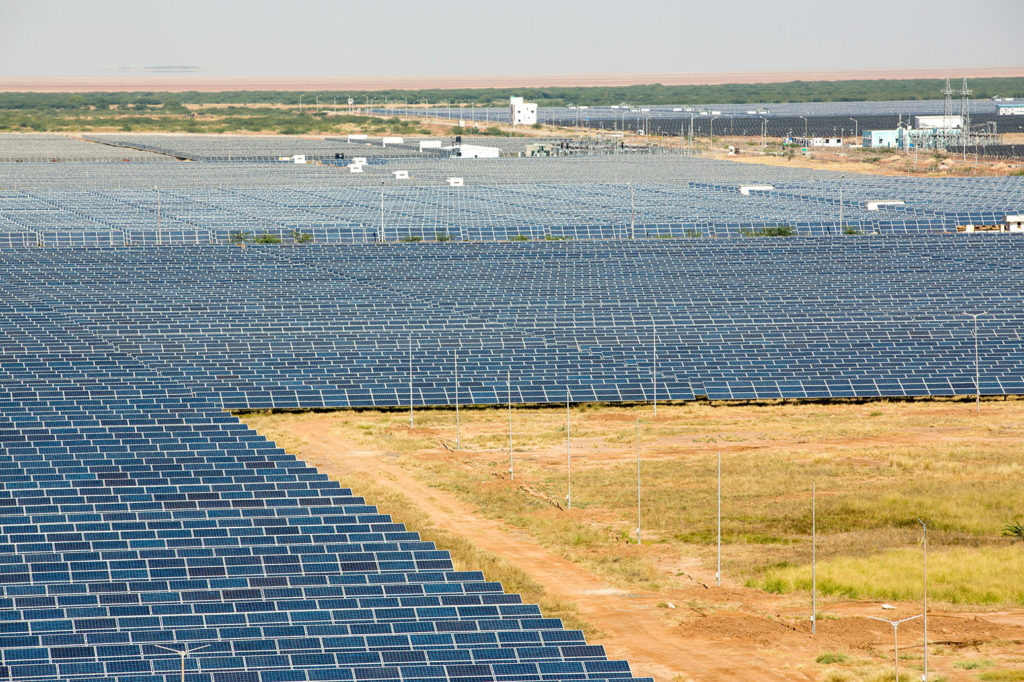
§ Energy efficiency
pridedemissions intensityEnergy Conservation ActBureau of Energy Efficiencysaysvoluntary goalNational Mission for Enhanced Energy Efficiencytargets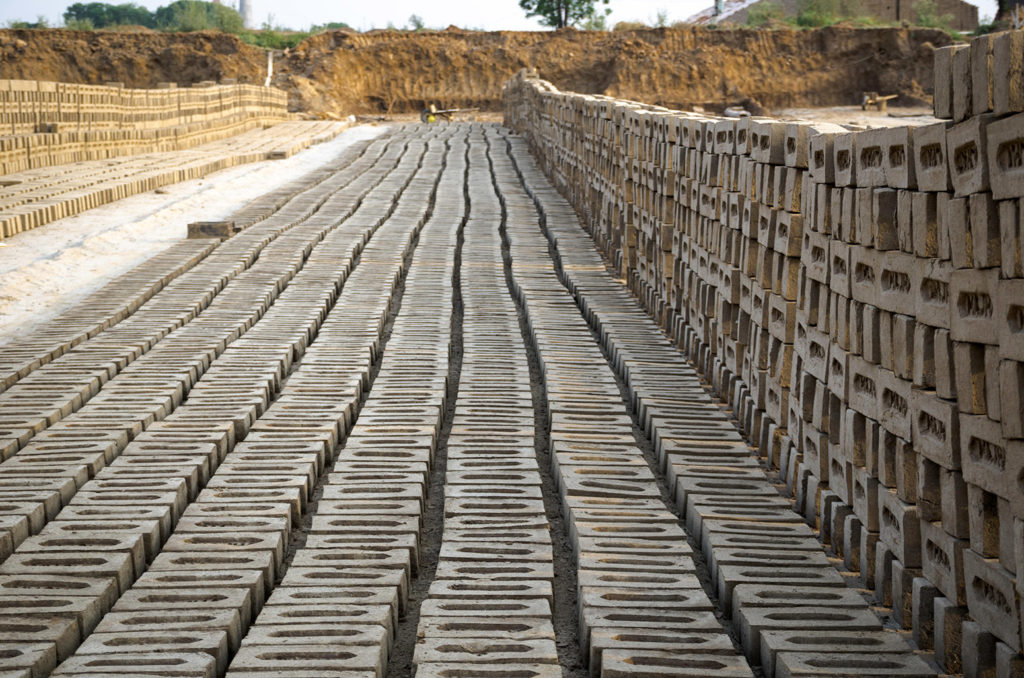
§ Transport
fifthgrow oil demandpromotesonlyonly 0.6%remains lowaround 1.5mtypically used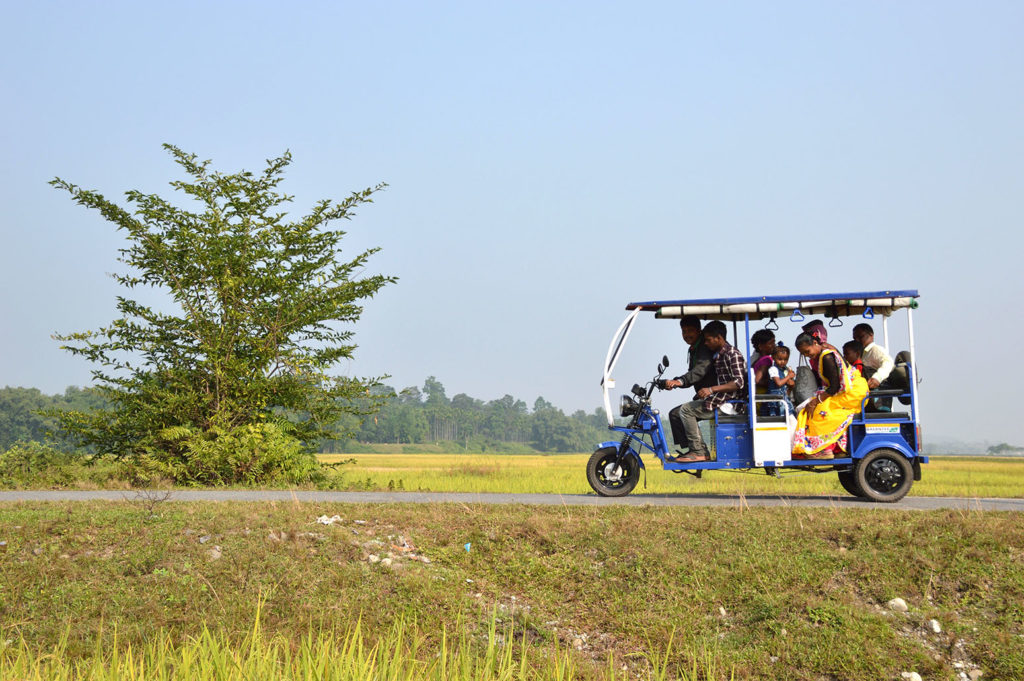
§ Oil and gas
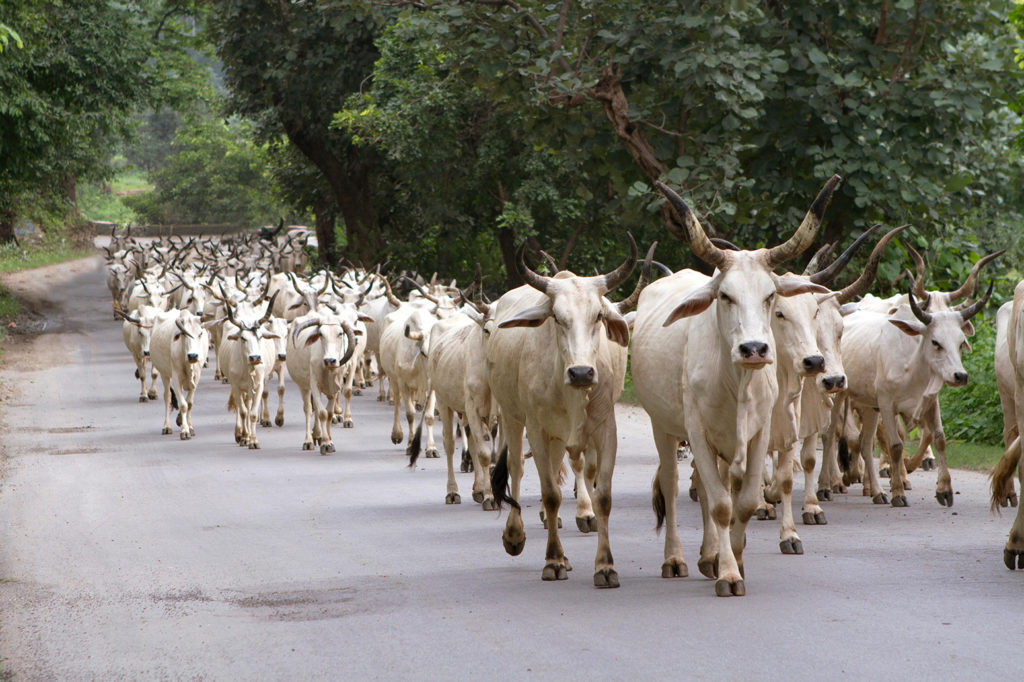
made uprising fastmore than doublecouldfallingconsumption subsidiesfellreformsoil pricesongoinghighlighted“Give it Up”subsidyLPG cooking gasimpactsexpectedroad-buildingnever playedonly 6%currently importsQatarUSRussiarisingstrugglesaimscitingsubstantial potentialdomestic gas and oil reservespanelconcludedreportedly§ Agriculture and forests
aroundrice cultivationfertilisers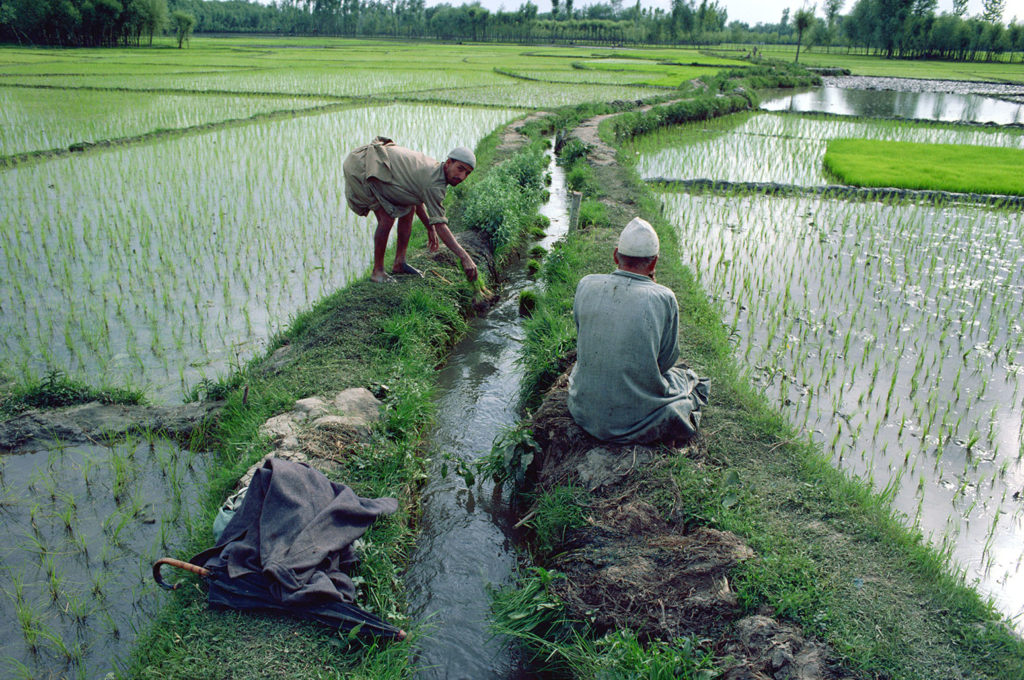
§ Impacts and adaptation
“Few countries in the world are as vulnerable to the effects of climate change as India is with its vast population that is dependent on the growth of its agrarian economy, its expansive coastal areas and the Himalayan region and islands.”
points outalready highly vulnerablerisencouldWorld Bankstudychanging monsoon rainfall patterns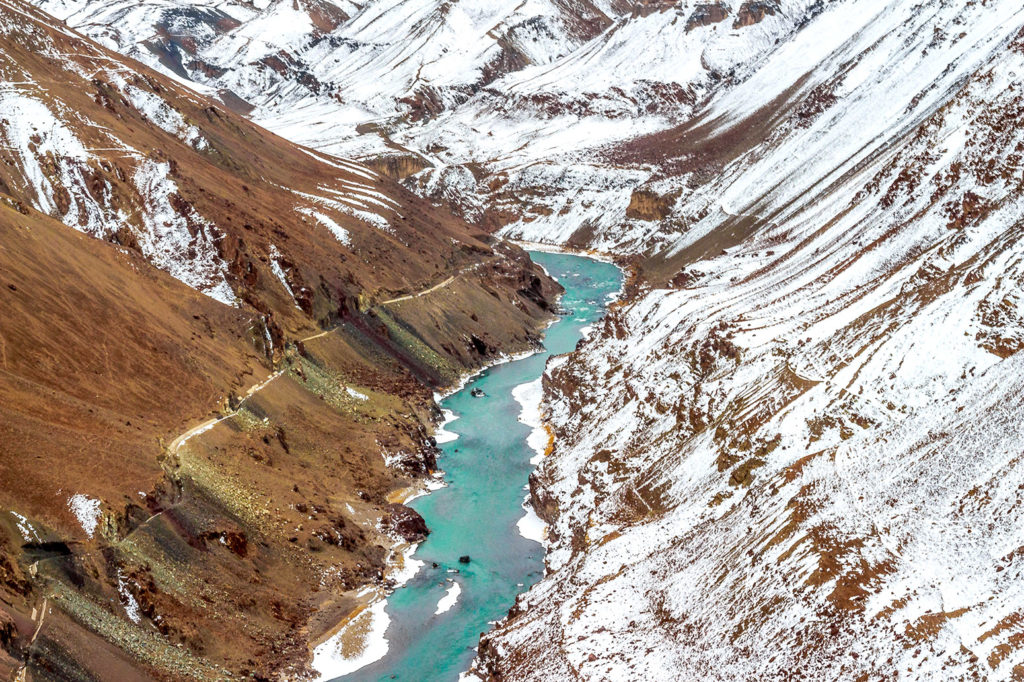
§ Climate finance
emphasis“[O]ur efforts to avoid emissions during our development process are also tied to the availability and level of international financing and technology transfer since India still faces complex developmental challenges.”
saysaroundanalysisClean Technology Fund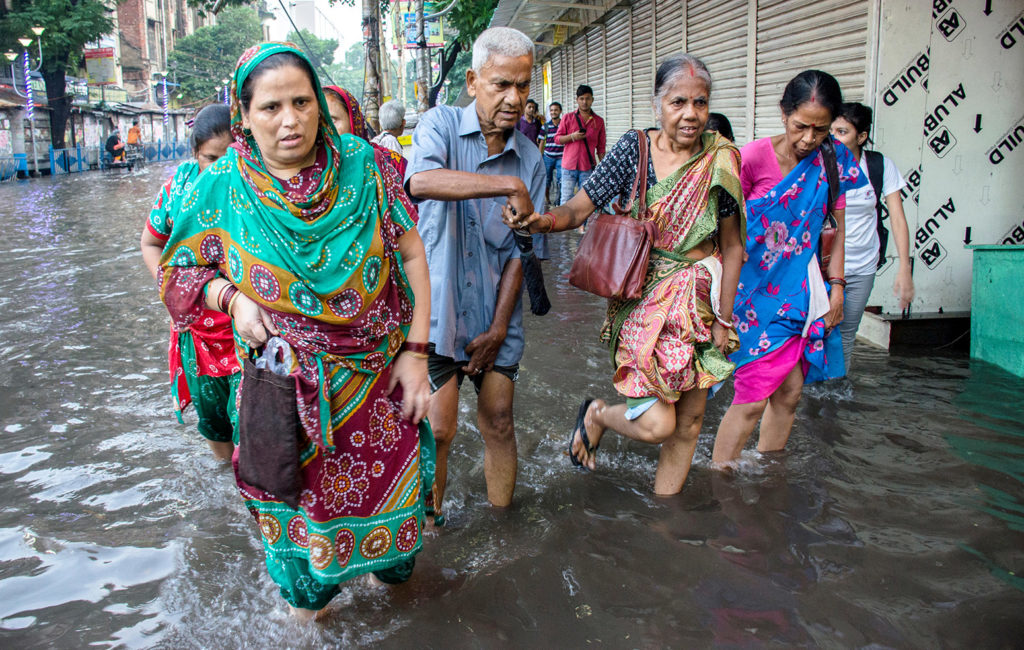
Article information
Note on infographic
Data for energy consumption comes from BP Statistical Review of World Energy 2018. Greenhouse gas emissions up to 2016 come from combining emissions data compiled by the Potsdam Institute for Climate Impact Research (PIK).
The graph showing emissions by sector comes from combining two datasets. Values for methane (CH4), nitrous oxide (N2O) and fluorinated gases cover all sectors, including LULUCF, and come from the PIK primap database v2.0. Values for GHG emissions from LULUCF also come from the PIK primap database, however these are only available to 2015, and from the earlier v1.2 of the database.
This combined PIK primap database v1.2 and 2.0 data for GHG emissions in 2015 also shows India has the world’s third largest greenhouse gas emissions (inc LULUCF). India’s pledge to reduce the “emissions intensity” of its economy 33-35% by 2030, compared to 2005 levels, comes from its NDC submitted to the UN in 2015. Its aim for 40% of installed electricity capacity to be renewable or nuclear by 2030 also comes fro this pledge.
Per capita emissions in 2015 come from combining above 2015 figure for GHG emissions and India’s population in 2015 from the World Bank.
The remaining values come from the EDGAR CO2 emissions database, downloaded from the website OpenClimateData. The EDGAR categories described in full are as follows: Buildings (non-industrial stationary combustion: includes residential and commercial combustion activities); Transport (mobile combustion: road and rail and ship and aviation); Non-combustion (industrial process emissions and agriculture and waste); Industry (industrial combustion outside power and heat generation, including combustion for industrial manufacturing and fuel production); Power & heat (power and heat generation plants).