The Carbon Brief Profile: Australia
In the seventh article of a series on how key emitters are responding to climate change, Carbon Brief looks at Australia’s complex climate politics and rising fossil fuel exports.[contentbox id=”29536″]Climate change is a top tier political issue in Australia. Debates over climate and energy policy have triggered several of the numerous changes of prime minister in recent years.Australia had the world’s 15th largest greenhouse gas emissions in 2015 and its citizens’ per-capita contribution is around three times the global average.It is the world’s second largest coal exporter and recently became the top exporter of liquified natural gas (LNG). Its electricity system remains heavily reliant on coal, despite ramping up the use of gas and renewables, especially rooftop solar.It is also highly vulnerable to the effects of climate change, including extreme heat, drought, bushfires and agricultural impacts.Based on its current trajectory, Australia is off track on its international pledge to cut emissions 26-28% by 2030 compared to 2005 levels.Opinion polls suggest the opposition Labor party will win the upcoming federal election, expected in May.(Update 24/05/2019: The Liberal-National Coalition’s victory in the May election came as a shock to many commentators who thought climate change was going to be a decisive factor that would lead to a win for Labor. The result has raised concerns that policies to tackle global warming, such as a transition away from coal, will not be at the top of the government’s agenda in the coming years. To get a sense of the different parties’ positions on climate and energy issues, see our summary of manifesto pledges made in the run-up to the election.)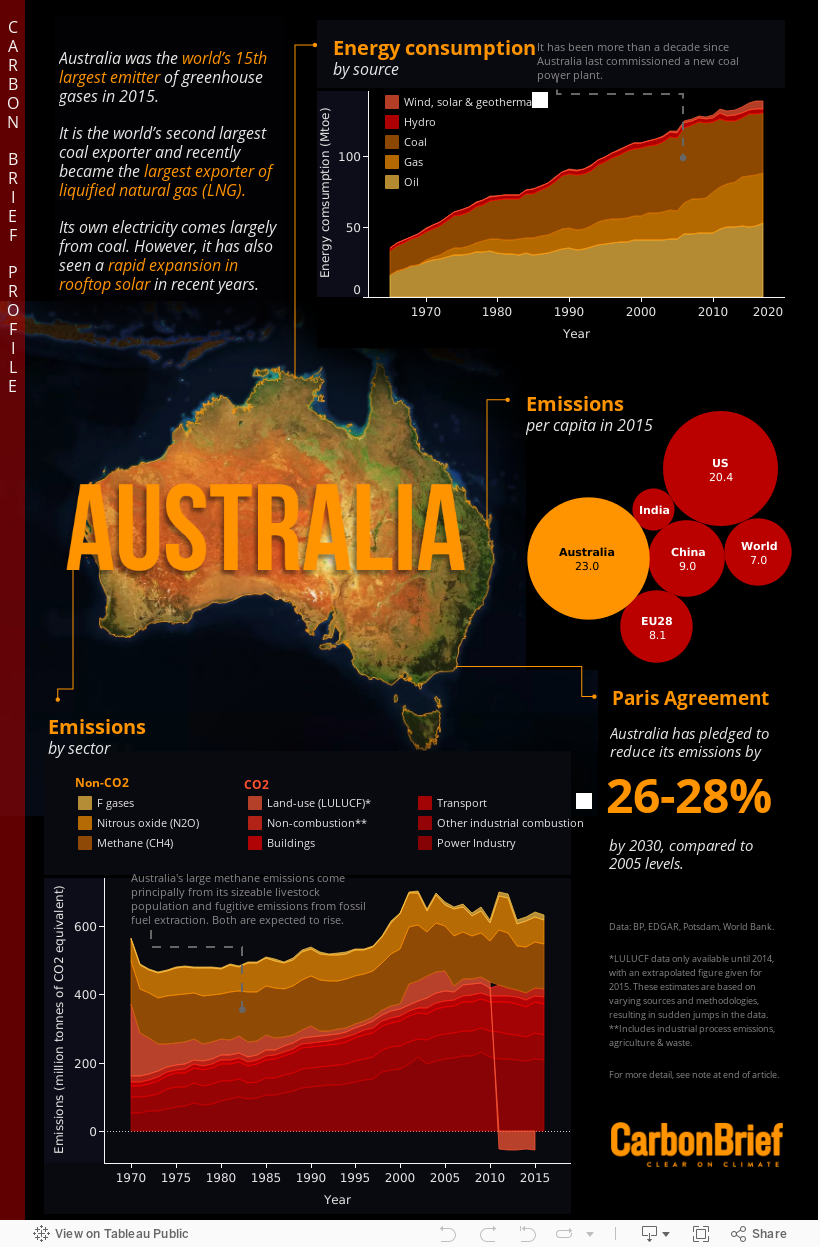
§ Politics
13thGDP25 million33 millionfive changesLiberalNationalScott MorrisonMalcolm TurnbullTony AbbottLabor partyKevin RuddJulia GillardexpectedMaypollsprojected winBill Shortenlong and complexhighly politicisedSome pollsjoinedschool climate strikesISISpollPew Research CentresurveyAustralia Institute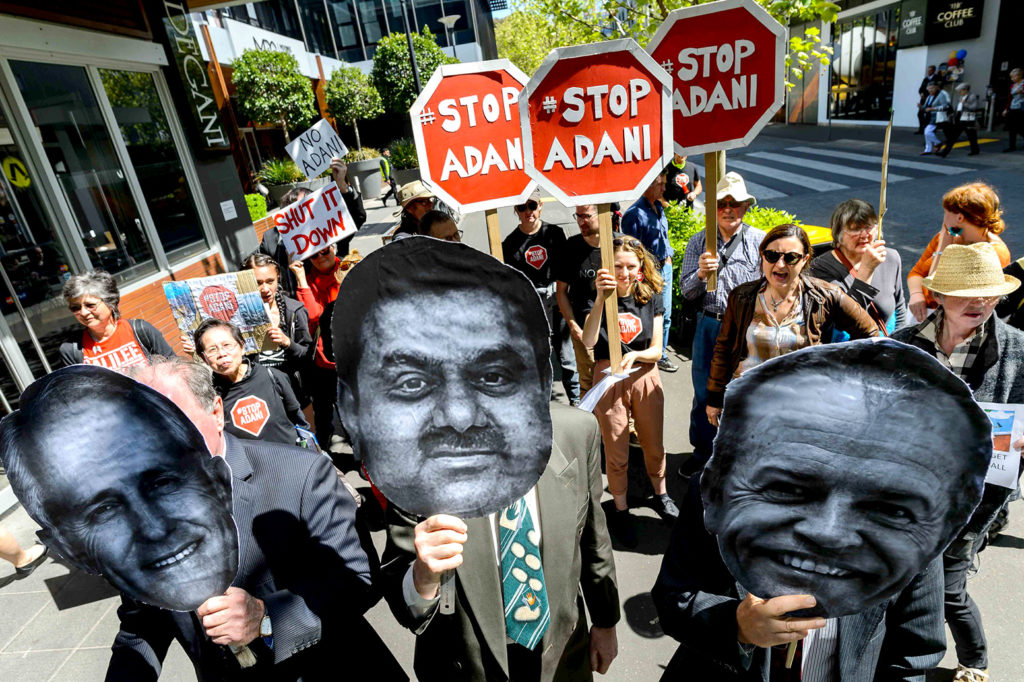
§ Paris pledge
land-use and forestrydataPotsdam Institute for Climate Impact ResearchsubmittedpledgeParis climate talks. This equivalent“This effort takes account of Australia’s unique national circumstances, including a growing population and economy, role as a leading global resources provider, our current energy infrastructure, and higher than average abatement costs.”
Climate Change Authoritypreviously recommendedEmissions Reduction Fundschemeplanenergy productivity23tCO2e in 2015World Bank UN population projectionsratedClimate Action Tracker“To meet its ‘insufficient’ 2030 emissions targets, Australian emissions should decrease by an annual rate of 1.5-1.7% until 2030; instead, with current policies, they are set to increase by an annual rate of around 0.3% per year.”
Climate TransparencysaysanalysisAustralian National Universitydisputedreview
§ Climate policy
climate policiesadjustedcancelledscrappedlarge differenceremovednational energy guaranteeousted himdropping the NEG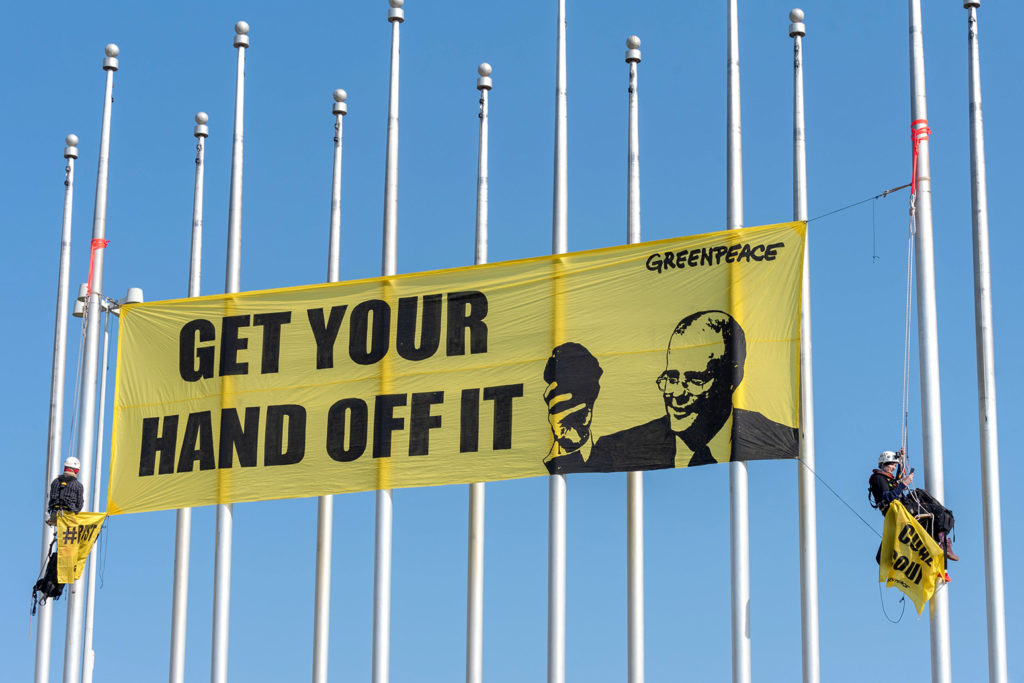
“Our government will take, and is taking, meaningful, practical, sensible, responsible action on climate change without damaging our economy or your family budget.”
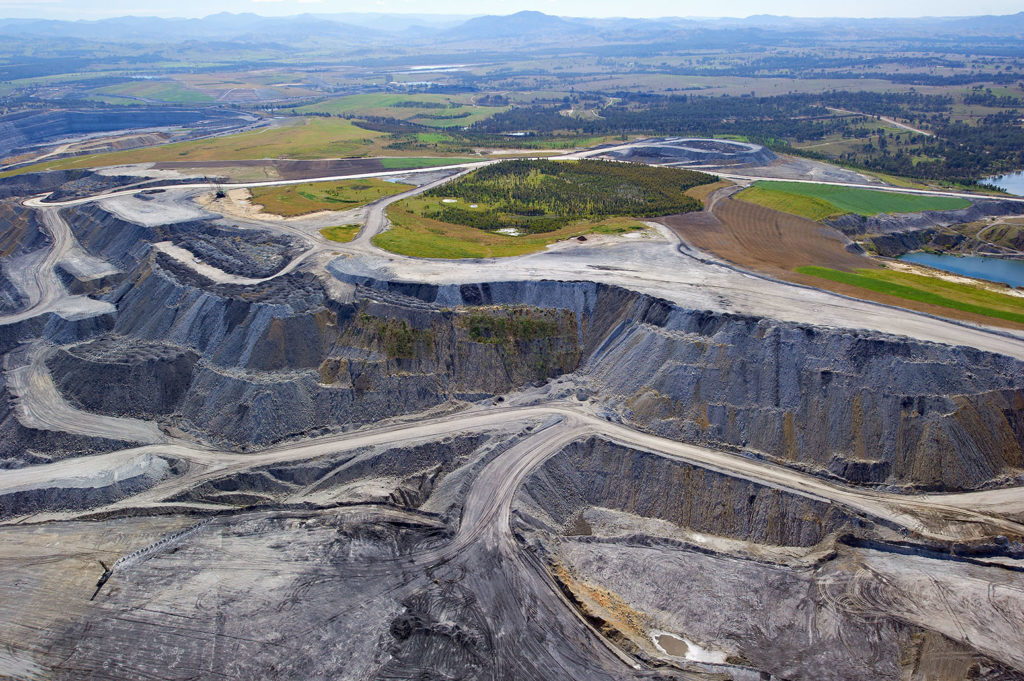
saidclimate change plancalledsupportsplangreen bankplanrecentlyGreen partyannouncedpoliciessolar fuelsAll states and territoriestargeting§ Coal
§ Renewables
more than tripledhouseholdsrising to a thirdprovidesalmost non-existentmore solar farmsMore than a millionaround an eighthset to buildsolar thermal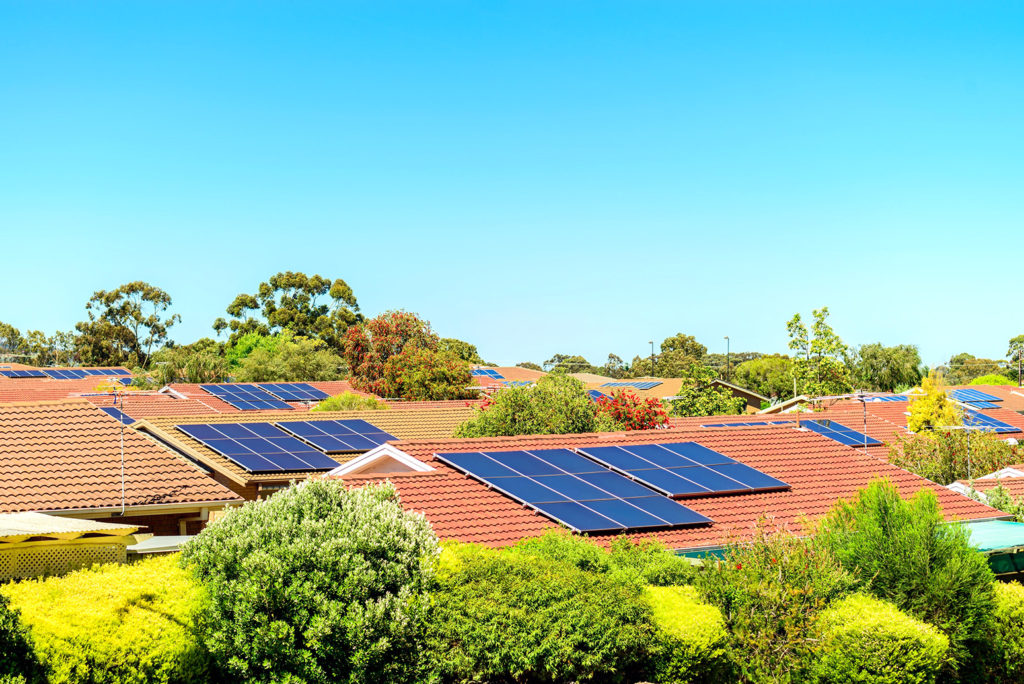
§ Oil and gas
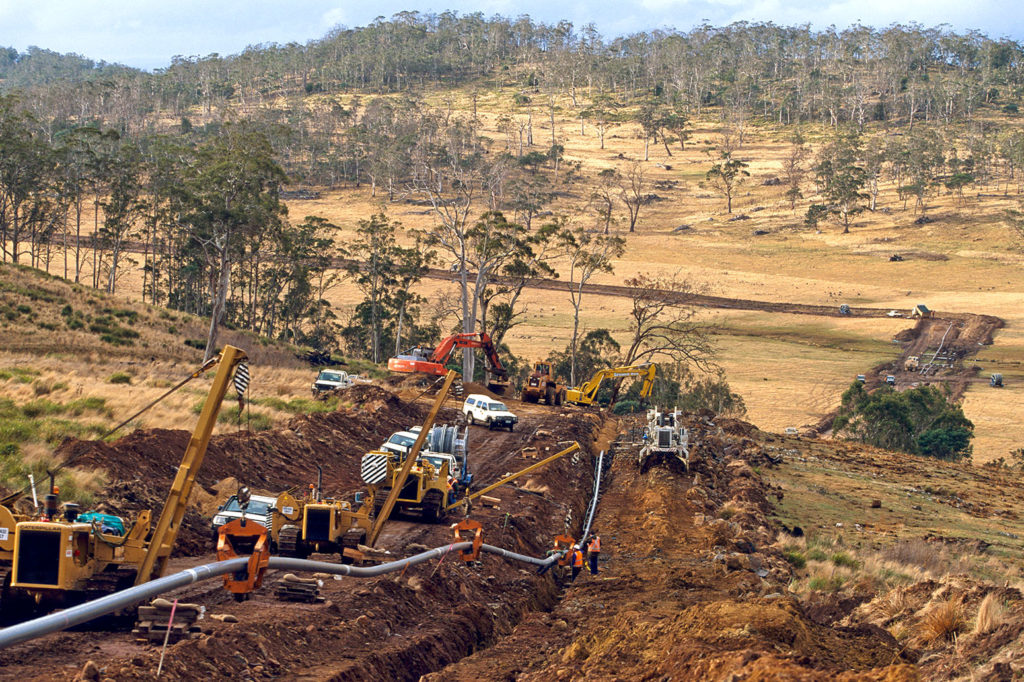
widespreadonshore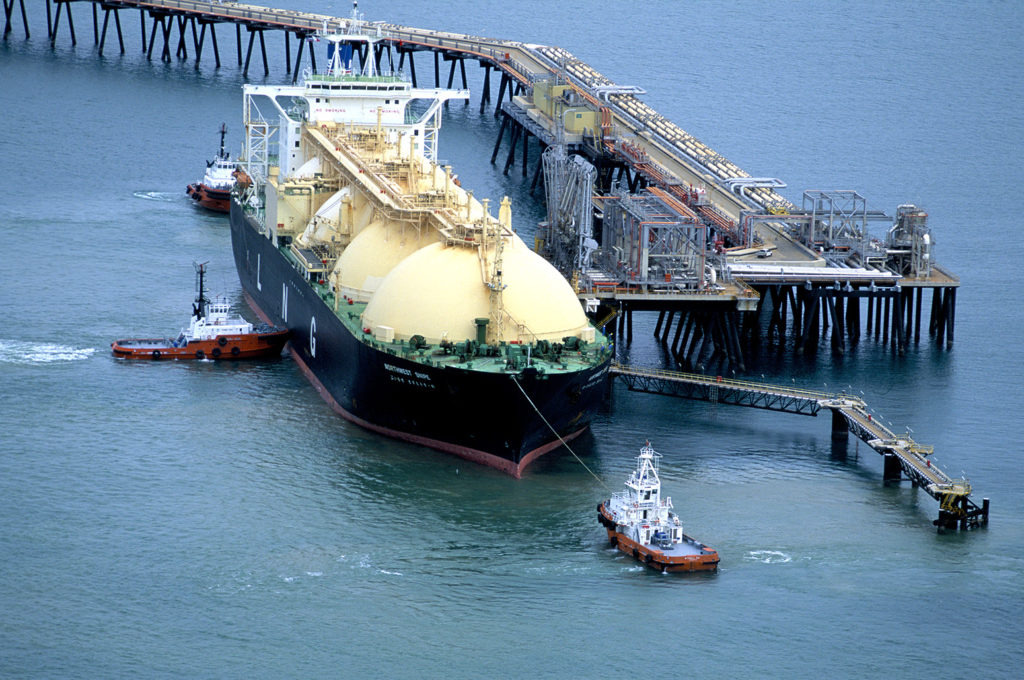
§ Transport
expects80% of the global marketfuel-efficiency standardsPrevious proposalscut downlags behindaccordingEV trade bodytotal motor salessmall incentivesreportEV strategylacks support measuresproposed§ Agriculture and forestry
large agricultural emissionsdue to methane releasedaround65m sheep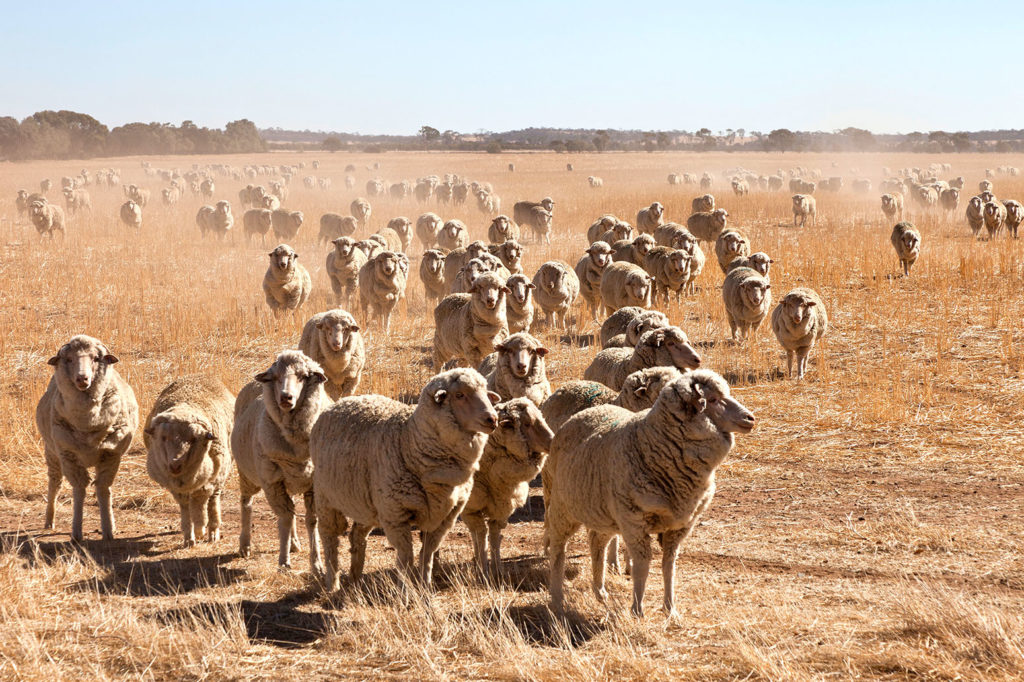
§ Climate laws
establishedmodelled closelyCommittee on Climate Changefailedshrunk significantlyclosedClimate CommissionresurrectedClimate Councilgreenhouse and energy reporting actreportingrenewable electricity targetERFact§ Impacts and adaptation
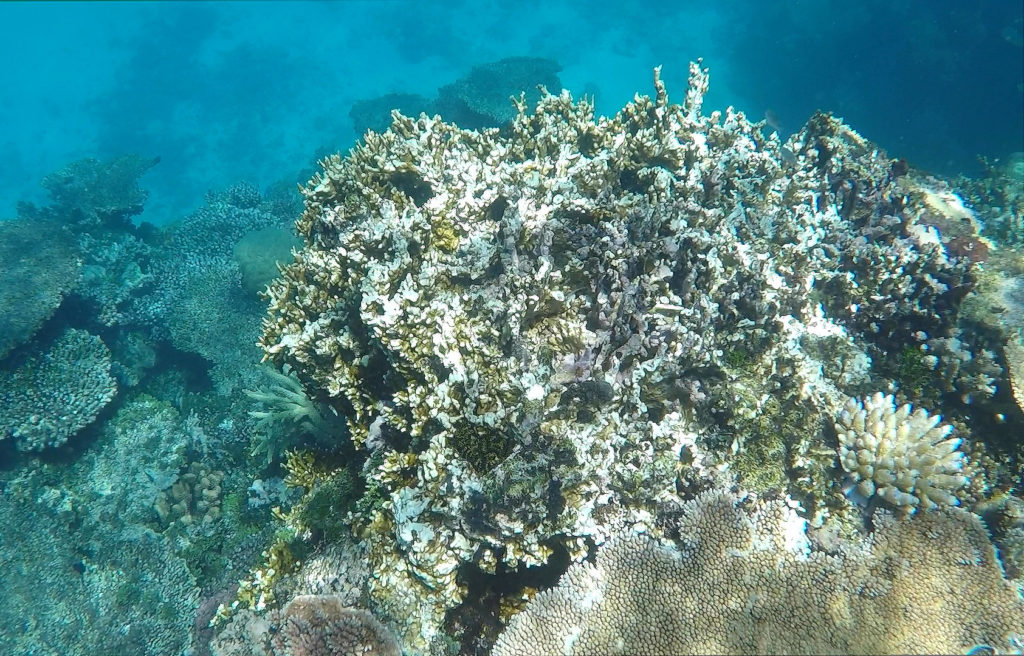
national communicationalready risendepending onhottest summer on recordmultiple otherBureau of MeteorologysaysMurray-Darling Basinalreadypaperauthoritythree mass fish deathsconcludedreportless suitable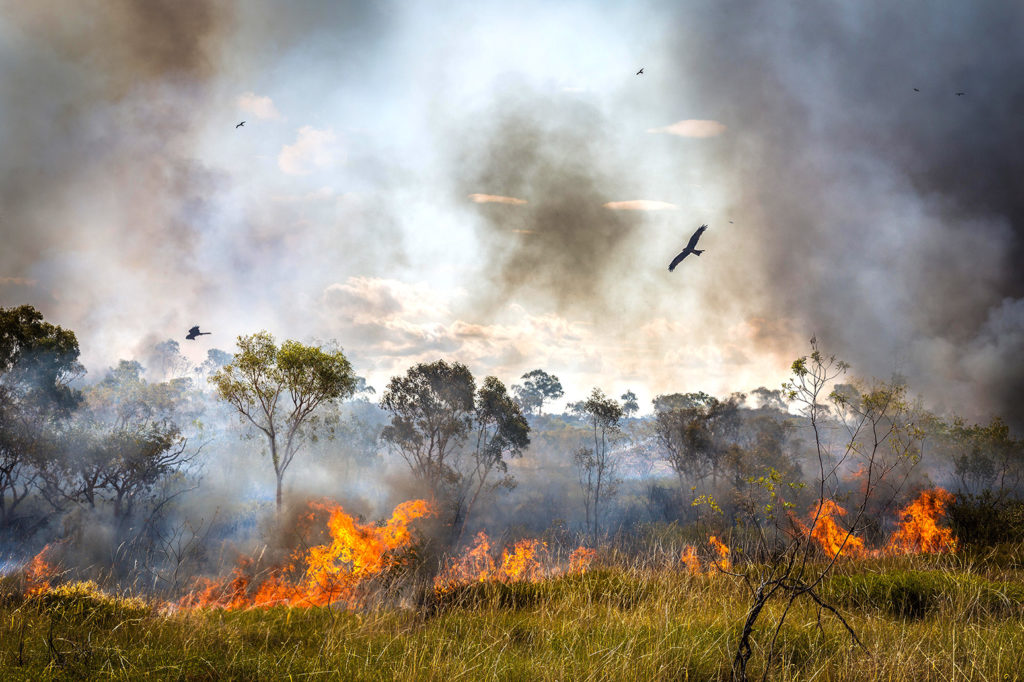
Article information
Note on infographic
Data for energy consumption comes from BP Statistical Review of World Energy 2018.
Data for greenhouse gas emissions by sector is a combination of two datasets compiled by the Potsdam Institute for Climate Impact Research (PIK) and EDGAR.
Values for methane (CH4), nitrous oxide (N2O) and fluorinated gases cover all sectors, including LULUCF, and come from the PIK primap database v2.0. Values for GHG emissions from LULUCF also come from the PIK primap database, however these are only available to 2015, and from the earlier v1.2 of the database. Note that LULUCF data for 2015 is an extrapolation made by PIK from previous years.
The remaining values come from the EDGAR CO2 emissions database, downloaded from the website OpenClimateData. The EDGAR categories described in full are as follows: Buildings (non-industrial stationary combustion: includes residential and commercial combustion activities); Transport (mobile combustion: road and rail and ship and aviation); Non-combustion (industrial process emissions and agriculture and waste); Industry (industrial combustion outside power and heat generation, including combustion for industrial manufacturing and fuel production); Power & heat (power and heat generation plants).
Combining GHG emissions in 2015 (bar LULUCF) from PIK primap database 2.0 database and LULUCF emissions in 2015 from PIK database v1.2 also shows Australia has the world’s 15th largest greenhouse gas emissions, including LULUCF, in 2015.
Per capita emissions in 2015 come from combining above 2015 figure for GHG emissions and Australia’s population in 2015 from the World Bank.
Australia’s pledge to reduce its emissions 26-28% below 2005 levels by 2030 comes from its NDC submitted to the UN in 2015.
Infographic by Tom Prater for Carbon Brief