Climate change has influenced global drought risk for ‘more than a century’

Daisy Dunne

The influence of human-caused climate change on global drought risk could extend back for more than a century, a study finds.By studying tree-ring records from across the world, researchers have, for the first time, traced the “fingerprint” of climate change on drought risk back to 1900 – a time when the UK and the US were the world’s top two emitters.The findings reveal the “surprising” impact of climate change on global drought risk, the lead author tells Carbon Brief. “The thought that humans could have influenced global drought that far back in time is really stunning.”The research is “significant because it shows – for the first time – a detectable human-induced change in global drought”, another scientist tells Carbon Brief.

§ Ring bearers

costlyagricultureecosystemssocietiesless than straightforwardNaturePalmer drought severity indexDr Kate MarvelColumbia UniversityGISS

“Tree rings give us a picture of conditions during the summer growing season. If it’s a wet year with plenty of soil moisture, trees grow more. If it’s a dry year, they grow less. So the thickness of individual tree rings measures that year’s soil moisture.”

Droughts are among the most natural disasters, affecting , and . But understanding how climate change has affected global drought risk is .This is partly because there are many ways to define what a drought is. While a climate scientist may define drought as a simple lack of rainfall, an agricultural scientist may define drought by its effect on soil moisture and crop growth.The new study, published in , makes use of the (PDSI), which considers how warming affects rainfall and evapotranspiration, as well as soil moisture.To study soil moisture, the researchers made use of tree-ring records stretching back 600-900 years, explains lead author , a research scientist at and the Nasa Goddard Institute for Space Studies (). She tells Carbon Brief:

§ Tracing a fingerprint

fingerprinting
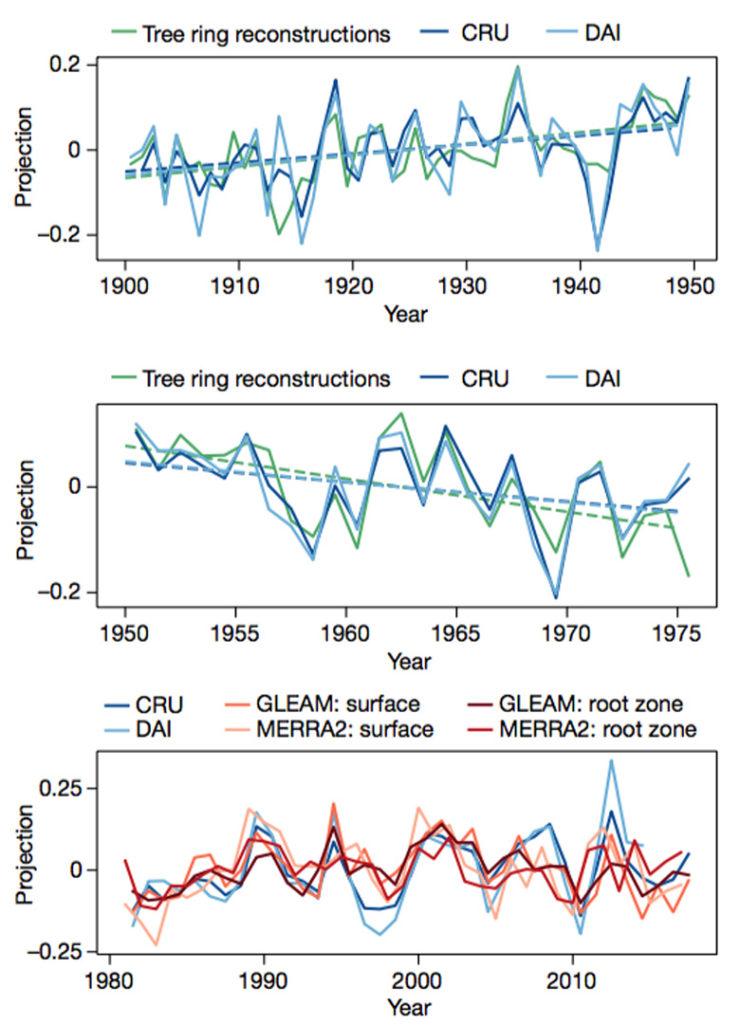
Image (note)
Glossary
RCP8.5: The RCPs (Representative Concentration Pathways) are scenarios of future concentrations of greenhouse gases and other forcings. RCP8.5 is a scenario of “comparatively high greenhouse gas emissions“ brought about by rapid population growth, high energy demand, fossil fuel dominance and an absence of climate change policies. This “business as usual” scenario is the highest of the four RCPs and sees atmospheric CO2 rise to around 935ppm by 2100, equivalent to 1,370ppm once other forcings are included (in CO2e). The likely range of global temperatures by 2100 for RCP8.5 is 4.0-6.1C above pre-industrial levels. The release of the Shared Socioeconomic Pathways (SSPs) has introduced a number of additional “no-new-policy” scenarios, meaning RCP8.5 is no longer the sole option available to researchers as a high-end no-mitigation pathway.
RCP8.5: The RCPs (Representative Concentration Pathways) are scenarios of future concentrations of greenhouse gases and other forcings. RCP8.5 is a scenario of “comparatively high greenhouse gas emissions“ brought about by rapid population growth,… Read More
model simulationsvolcanic eruptionsaerosolsRCP8.5
Image - The strength of the relationship between PDSI estimates from observational data – tree-ring reconstructions (green) and meteorological datasets (CRU, dark blue; DAI, light blue) – and a climate change “fingerprint”. On the y-axis, a number above zero indicates a positive trend, while numbers below zero indicate a negative trend. Results are shown for three time periods: 1900-49 (top), 1950-75 (middle) and 1980-2017 (bottom). On bottom chart, tree ring reconstructions are replaced with modern surface (orange) and plant root (red) soil moisture datasets. Source: Marvel et al. (2019) - Three line charts showing The strength of the relationship between PDSI estimates from observational data – tree-ring reconstructions (green) and meteorological datasets (CRU, dark blue; DAI, light blue) – and a climate change “fingerprint”. On the y-axis, a number above zero indicates a positive trend, while numbers below zero indicate a negative trend. Results are shown for three time periods: 1900-49 (top), 1950-75 (middle) and 1980-2017 (bottom). On bottom chart, tree ring reconstructions are replaced with modern surface (orange) and plant root (red) soil moisture datasets. Source: Marvel et al. (2019) (note)
outpouring of aerosols

“In the middle of the 20th century, increased aerosol emissions – the gas and particulate matter we think of as pollution – likely played a big role [in influencing drought risk], counteracting the response to greenhouse gases.”

cooling impactclean air lawslevel off

“If we don’t see it coming in stronger in, say, the next 10 years, we might have to wonder whether we are right. But all the models are projecting that you should see unprecedented drying soon, in a lot of places.”

To understand to what extent human-caused climate change could have driven the changes observed in tree-ring records, the researchers used a “” technique.The scientists compared the tree ring and meteorological records to of the climate from 1900 to 2100. These simulations included a range of factors that can influence drought risk, including and . To include the impact of human-caused climate change, the researchers used a high greenhouse gas emissions scenario known as .The researchers then studied the data to see if the “fingerprint” of human-caused climate change observed in the climate model simulations matched up with the pattern seen in the tree ring and meteorological records of drought.The charts below, taken from the research paper, show the strength of the trend between the tree-ring and meteorological records and the “fingerprint” of climate change.On the y-axis, a number above zero indicates a positive relationship – or that the fingerprint and observational records are similar – while numbers below zero indicate a negative relationship. Results are shown for three time periods: 1900-49 (top), 1950-75 (middle) and 1980-2017 (bottom).On the top two charts, green represents the tree-ring reconstructions, while light and dark blue represent two meteorological datasets. On the bottom chart, two modern surface (orange) and plant root (red) soil moisture datasets are also shown in place of the tree-ring records.On the first chart, a positive trend is shown. This indicates that the tree-ring and meteorological records from that time “increasingly resemble the fingerprint”, the authors write in their research paper. In other words, there is a clear climate-change signal in drought risk from 1900-49.On the middle chart, the trend is negative. This suggests “all three datasets are increasingly dissimilar to the fingerprint”.This does not mean that climate change did not influence drought from 1950-75, the authors say. Rather, they suspect that the cooling effect created by an from fossil-fuel industries in this period could have masked the impact of climate change on drought, Marvel explains:Aerosols can have a by blocking incoming sunlight, as well as by affecting regional cloud formation and rainfall.The last chart indicates that the climate change signal becomes positive once again around the end of the 20th century.This roughly coincides with the time in which many countries in the northern hemisphere introduced tougher , which caused aerosol emissions to . However, greenhouse gas emissions continued to rise rapidly, which could explain why the positive signal returned, the authors say.Since this point, the signal has not become much stronger, the research suggests. Marvel says:

§ Parched

“It really did surprise me, personally – the thought that humans could have influenced global drought that far back in time is really stunning.”

Prof Peter StottattributionMet Office Hadley Centre

“I think it’s pretty significant because it shows – for the first time – a detectable human-induced change in global drought. This paper also provides a reason why it hasn’t been possible to detect human-induced changes in drought before now. This is because of the confounding effects of anthropogenic aerosols.”

IPCCAR6

“It could well strengthen the assessment given that changes in the water cycle was a key uncertainty in AR5 – [the last assessment report].”

Prof Sonia SeneviratneETH Zurich

“The tree-ring records are only available in limited parts of the globe – in North America, Mexico, Europe, Asia and Australia. This does not include the Arctic region and northern Asia, nor South America or Africa. The covered regions include a slight bias towards mid-latitude and semi-arid regions, which are known to tend towards drying under warmer climate.”

“It is a bit surprising that the signal is particularly large for the time frame 1900-1949, but does not reach high confidence in the time frame 1981-2017, given that the total global warming in the latter period was probably larger. This might be due to the fact that [natural] climate variability plays a larger role over shorter time frames, but could also be related to regional effects.”

Article information

Marvel, K. et al. (2019) Twentieth-century hydroclimate changes consistent with human influence, Nature, https://www.nature.com/articles/s41586-019-1149-8

Overall, the findings add to the growing evidence that climate change has – and will continue – to influence global drought risk, says Marvel:The research is “innovative” and produces “robust” findings, says , a leading climate change scientist from the , who was not involved in the study. He tells Carbon Brief:The results will likely influence the next Intergovernmental Panel on Climate Change () assessment report (), he adds:The research is an “important scientific contribution”, but there are “limitations” that need to be “carefully evaluated”, says , a researcher of climate extremes from . She tells Carbon Brief:In addition, it is surprising that, according to the results, climate change did not have its largest impact on drought risk in recent years, she says:

🗂️ back to the index