The “globally coherent” rise in temperatures seen since the start of the industrial revolution is “unparalleled” in at least the past 2,000 years, a new study says.Over the past two millennia, the planet has experienced several episodes of extreme warming and cooling as a result of natural changes to the climate.The new research confirms, however, that these climate events were patchy – impacting different parts of the world at different times. By comparison, human-caused climate change affected 98% of the globe simultaneously through the 20th century, the research says.“This provides strong evidence that anthropogenic global warming is not only unparalleled in terms of absolute temperatures, but also unprecedented in spatial consistency within the context of the past 2,000 years,” the authors write in the journal Nature.A second research paper finds that the rate of decadal temperature rise seen in the late 20th century was also unprecedented, when compared to the past two millennia.The findings put “yet another nail in the coffin of the theory that today’s warming signal could be a natural fluctuation”, a leading climate scientist tells Carbon Brief.
“What we show is that these periods aren’t as globally coherent as previously thought and that the contemporary warm period [modern-day climate change] stands in stark contrast to this.”
The impact of human-caused climate change can be felt almost on Earth. Average global temperatures have risen by since the start of the industrial era but some regions, such as the Arctic’s Svalbard, have already seen increases of up to .Over the past few centuries, the world has seen multiple periods of unusually severe warming and cooling as a result of natural swings in the climate.One of the most well-known “warm” periods is the “”, which is commonly associated with elevated temperatures at around 800-1200AD. The mild conditions during this period may have helped the Vikings to conquer further north, suggests.Another is the “” – which is associated with warmer than average temperatures in the first few centuries of the first millennium.Notable cool periods include the “”, a period of colder than average temperatures and glacier advance between the 16th and mid-19th centuries, and the “”, a cold snap that affected some regions from 400-765AD.Because these events happened before modern temperature records began, there is still surrounding how extreme they were and in what exact years they occurred.Another outstanding question is to what extent these events were global – rather than regional.The new study builds on earlier work to address this question, says , a study author and research scientist at the at . He tells a press briefing:
“Trees in cold Arctic or alpine forests have annual rings with widths and wood densities that reflect year-to-year variations in summer temperature. And because the chemical make-up of seawater depends on its temperature, massive corals build endoskeletons that contain a permanent geochemical record of past warming and cooling.”
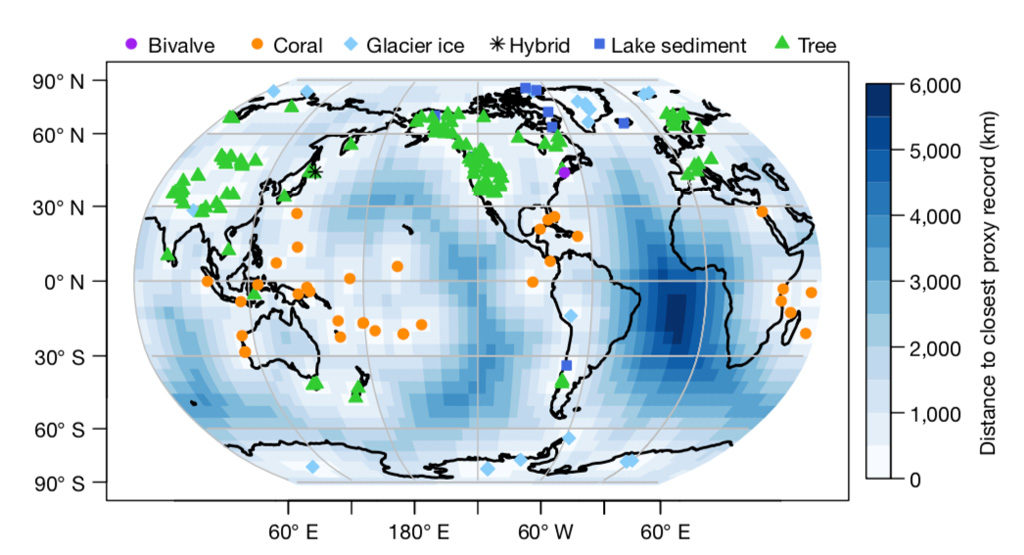
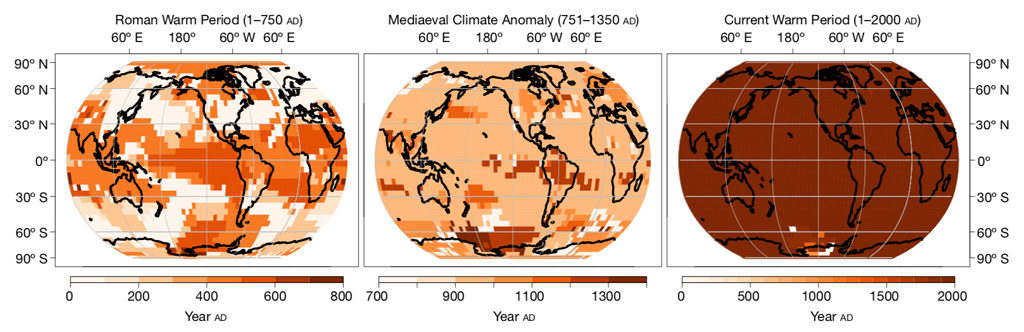
trees or boreholesImage - Map of “climate proxies” used in the new study, including bivalve molluscs such as clams, oysters and mussels (purple dots); coral (orange dots); glacier ice (blue diamonds); hybrid – trees or boreholes (black star); lake sediment (blue square) and trees (green). Shading on the map illustrates distance to closest proxy record. Source: Neukom et al. (2019) (note)Image - Maps showing the pattern of warming in the Roman Warm Period (left), Medieval Climate Anomaly (middle) and the Current Warm Period (right). On the maps, colour is used to illustrate the timing of the hottest 51-year period for each location. Source: Neukom et al. (2019) (note)AntarcticaTo look back into past climates, the researchers used a vast range of “” – biological or geochemical archives that contain embedded records of past temperature change.Examples of proxies include , glacier ice and ancient corals, explains , an environmental scientist from the , in a Nature News & Views article accompanying the new study. He writes:The map below shows the locations of climate proxy records used in the study. Proxies include bivalve molluscs such as clams, oysters and mussels (purple dots); coral (orange dots); glacier ice (blue diamonds); hybrid – (black stars); lake sediment (blue squares) and trees (green triangles).The researchers then used a wide range of statistical methods to analyse the proxy records.The study finds that no episode of past warming or cooling “shows global coherence in the timing of the coldest or warmest periods”.For example, during the Little Ice Age, the timing of the lowest temperatures seen in the proxy data varied from place to place.Two-fifths of the world felt cold temperatures during the mid-nineteenth century, whereas for other regions, the cold snap occurred several centuries earlier, the study says.And during the Medieval Climate Anomaly, only 40% of the world experienced peak temperatures at the same time, the findings show.In contrast, human-caused global warming affected 98% of the globe simultaneously at the end of the 20th century, the study says. (The study does not look at temperature change in the 21st century.)The maps below, taken from the paper, give an idea of the patchwork nature of past periods of warming (left: Roman Warming Period; middle: Medieval Climate Anomaly) in comparison to modern-day climate change (right).On the maps, colour is used to illustrate the timing of the hottest 51-year period for each location. For example, a dark patch indicates that the hottest temperatures occurred late in the climate era, while light colours indicate that the hottest temperatures occurred early on.The maps show that, for both the Roman Warm Period and the Medieval Climate Anomaly, the timing at which peak temperatures were reached varied widely at different points across the globe.In contrast, in the current warming period, almost all of the world (98%) experienced peak temperatures during the end of the 20th century.The notable exception is – “where contemporary warming has not yet been observed over the entire continent”, the authors say.
“We find that the most dramatic warming over the past 2,000 years occurred during the second half of the 20th century, which highlights the extraordinary character of current climate change.”
“Today’s human-induced warming signal is truly global in extent, whereas earlier events such as the Little Ice Age or Medieval Warm Period were only ever regional. The study puts these findings on a firm statistical footing and is yet another nail in the coffin of the theory that today’s warming signal could be a natural fluctuation.”
Neukom, R et al. (2019) Consistent multidecadal variability in global temperature reconstructions and simulations over the Common Era, Nature Geosciences, https://nature.com/articles/s41561-019-0400-0
The findings reinforce the need to see past warming and cooling events with a “regional framing”, the authors write in their research paper. They conclude:A second paper, published in by the same research group, looked at how the rate of warming and cooling on “multi-decadal timescales” has changed over the past 2,000 years. Lead author of both papers, , a paleoclimate scientist from the , tells the press briefing:The findings help to “confirm” earlier research that suggested that past episodes of warming and cooling were regional rather than global, says , climate scientist and director of the at the , who was not involved in the study. He tells Carbon Brief: