Met Office: A review of the UK’s climate in 2025
The UK’s climate saw a record-breaking 2025, with the year being both the warmest and sunniest seen since observations began.
The year 2025 has joined 2024, 2023, 2022 and 2014 in the UK’s top-five warmest years.
In this review, we take a look back at the UK’s climate in 2025 and place the record-breaking year in the context of human-caused climate change. We find:
- It was the warmest and sunniest year on record. January and September were the only months that were cooler than average.
- A Met Office attribution study estimates that 2025’s average temperature would have been exceptionally unlikely in pre-industrial times – but could now occur, on average, every three years.
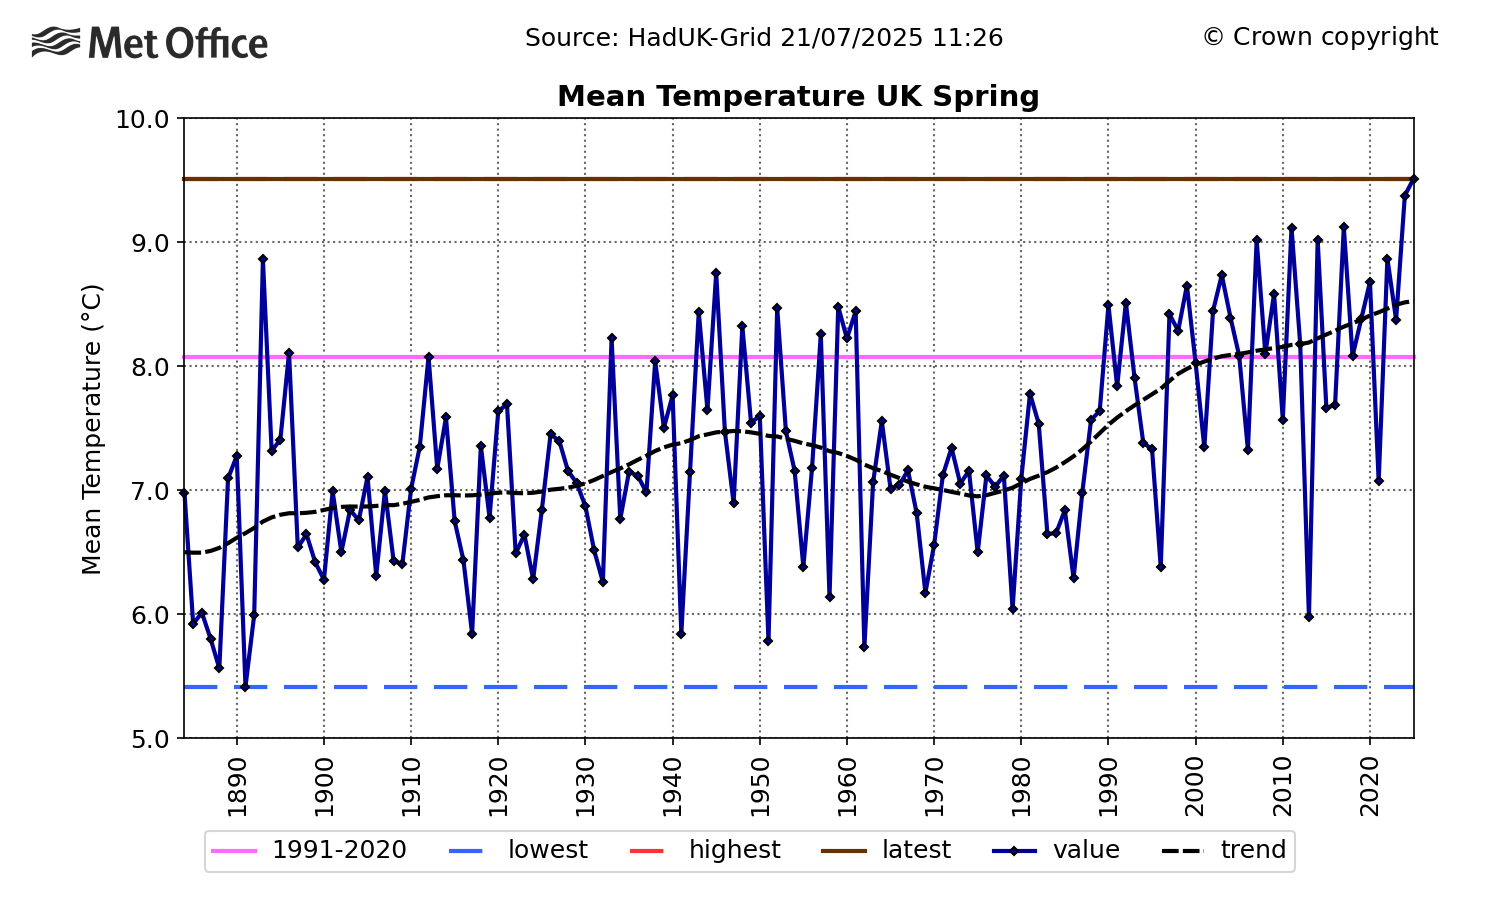
- Spring was the warmest on record, breaking a record set in 2024.
- Spring was not only the sunniest on record, but the fourth-sunniest season ever recorded, after the summers of 1976, 1996 and 1911.
- It was the warmest summer on record. The summer temperature record was made around 70 times more likely due to human-induced climate change.
- The persistent high-pressure systems in spring and summer, which contributed to the warm and sunny conditions, also resulted in an extended dry spell – including the driest spring since 1974.
- Wetter conditions at the end of the year alleviated some of the rain shortfall. The year concluded with 90% of average annual rainfall.
- Storm Éowyn in late January was the most powerful wind storm in over a decade and the most severe storm in Northern Ireland since 1998.
- Storm Floris in early August was not unprecedented for a storm, but was one of the most severe wind storms to affect Scotland during the summer.
- Storm Amy in early October hit north-western parts of the UK, with heavy rain falling widely, resulting in the wettest day of the year for the UK overall.
(See our previous annual analysis for 2024, 2023, 2022, 2021, 2020, 2019 and 2018.)
§ The year in summary
The Met Office relies on the long-running HadUK-Grid dataset to place recent UK weather and climate into its historical context. The gridded, geographically complete dataset combines observational data for monthly temperature since 1884, rainfall since 1836 and sunshine since 1910.
Unless stated otherwise, the rankings of events and statements (such as “warmest on record”) in this article relate to the HadUK-Grid series.
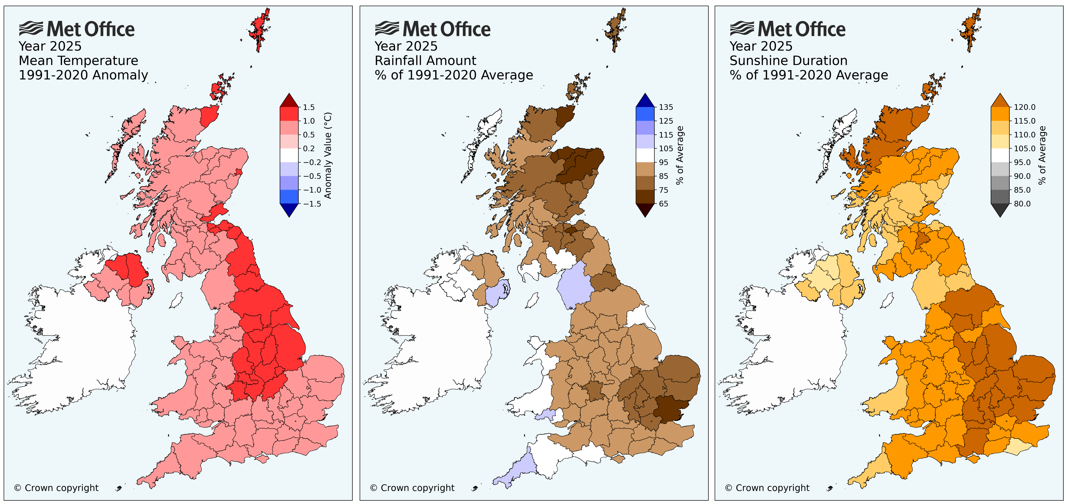
The “climate anomaly” maps below show the difference between the average temperature (left), rainfall total (middle) and sunshine duration (right) between 2025 and the 1991-2020 period. In other words, they show how much warmer, cooler, wetter, drier, sunnier or cloudier the year was than average for each county of the UK.
The maps show that the whole country was warmer than average, with central and north-east England, parts of Northern Ireland and the tip of north-west Scotland, Orkney and Shetland seeing the greatest change.
The UK overall had 90% of average rainfall. The driest regions relative to average were around Essex, Moray and Aberdeenshire, which received less than 75% of normal annual rainfall.
In contrast, some western counties were slightly wetter than average – including Cornwall (110%) and Cumbria (107%).
Sunshine was above average across the UK, with eastern England and north Scotland exceeding 120% of the average.
§ Attribution
The UK’s absolute temperature averaged at 10.09C in 2025. This follows 2022 (at 10.03C) as the second time that the annual average temperature has exceeded 10C.
In our analysis of the UK’s climate in 2022 for Carbon Brief, we reported on a Met Office attribution study that found that human-caused climate change had increased the likelihood of UK annual absolute temperature averaging above 10C by a factor 160.
That study concluded that exceeding 10C – while unprecedented in the historical observational record – would become increasingly common and would likely occur every three-to-four years.
Three years on from that analysis and the 10C threshold has been breached for a second time – and an updated attribution analysis has been produced exploring the likelihood of a return of temperatures above the 10.09C recorded in 2025.
The study, which uses the same methodology as the 2022 paper, finds that UK annual mean temperatures above 10.09C are estimated to occur approximately every three years in the current climate. In contrast, they would have occurred around every 780 years in pre-industrial times.
Human-caused climate change has, therefore, increased the probability of average temperatures in excess of 10.09C by a factor of 260.
These results show that 2025’s record-breaking annual temperature – while unprecedented in the historical observational record – should be considered fairly normal in the current climate.
Climate projections indicate that, by the later part of the 21st century, a year like 2025 could be a relatively cool year.
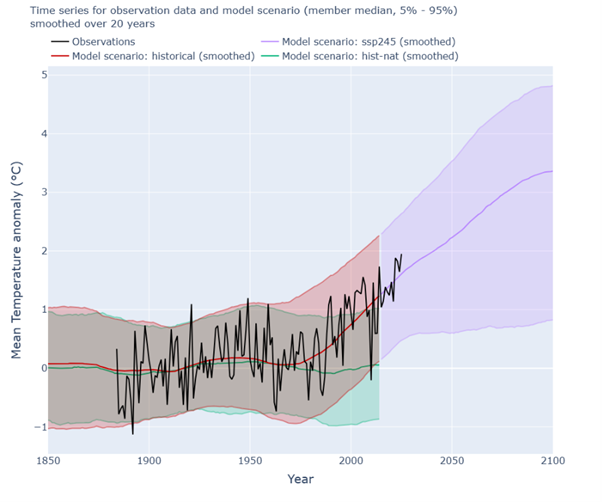
The figure below compares observations of UK annual average temperatures (black line) – relative to the long-term average – to climate model simulations that include (red/purple) or exclude (green) human-caused emissions of greenhouse gases and land-use change.
The green and red curves start to diverge from around the 1980s, suggesting that human influence is indeed the dominant factor in the warming trend. The shaded range of the simulations show that in our current and future climate, much warmer years than 2025 are plausible.
Colder years are also still possible, but it is much less likely that we would experience a cold year like 2010 – and exceptionally unlikely for a year to be in the top-10 coldest years for the UK. The most recent year to feature in the top-10 coldest years was 1963.
§ Warmer, wetter, sunnier
Four of the UK’s last five years all appear in the top-five warmest years since 1884.
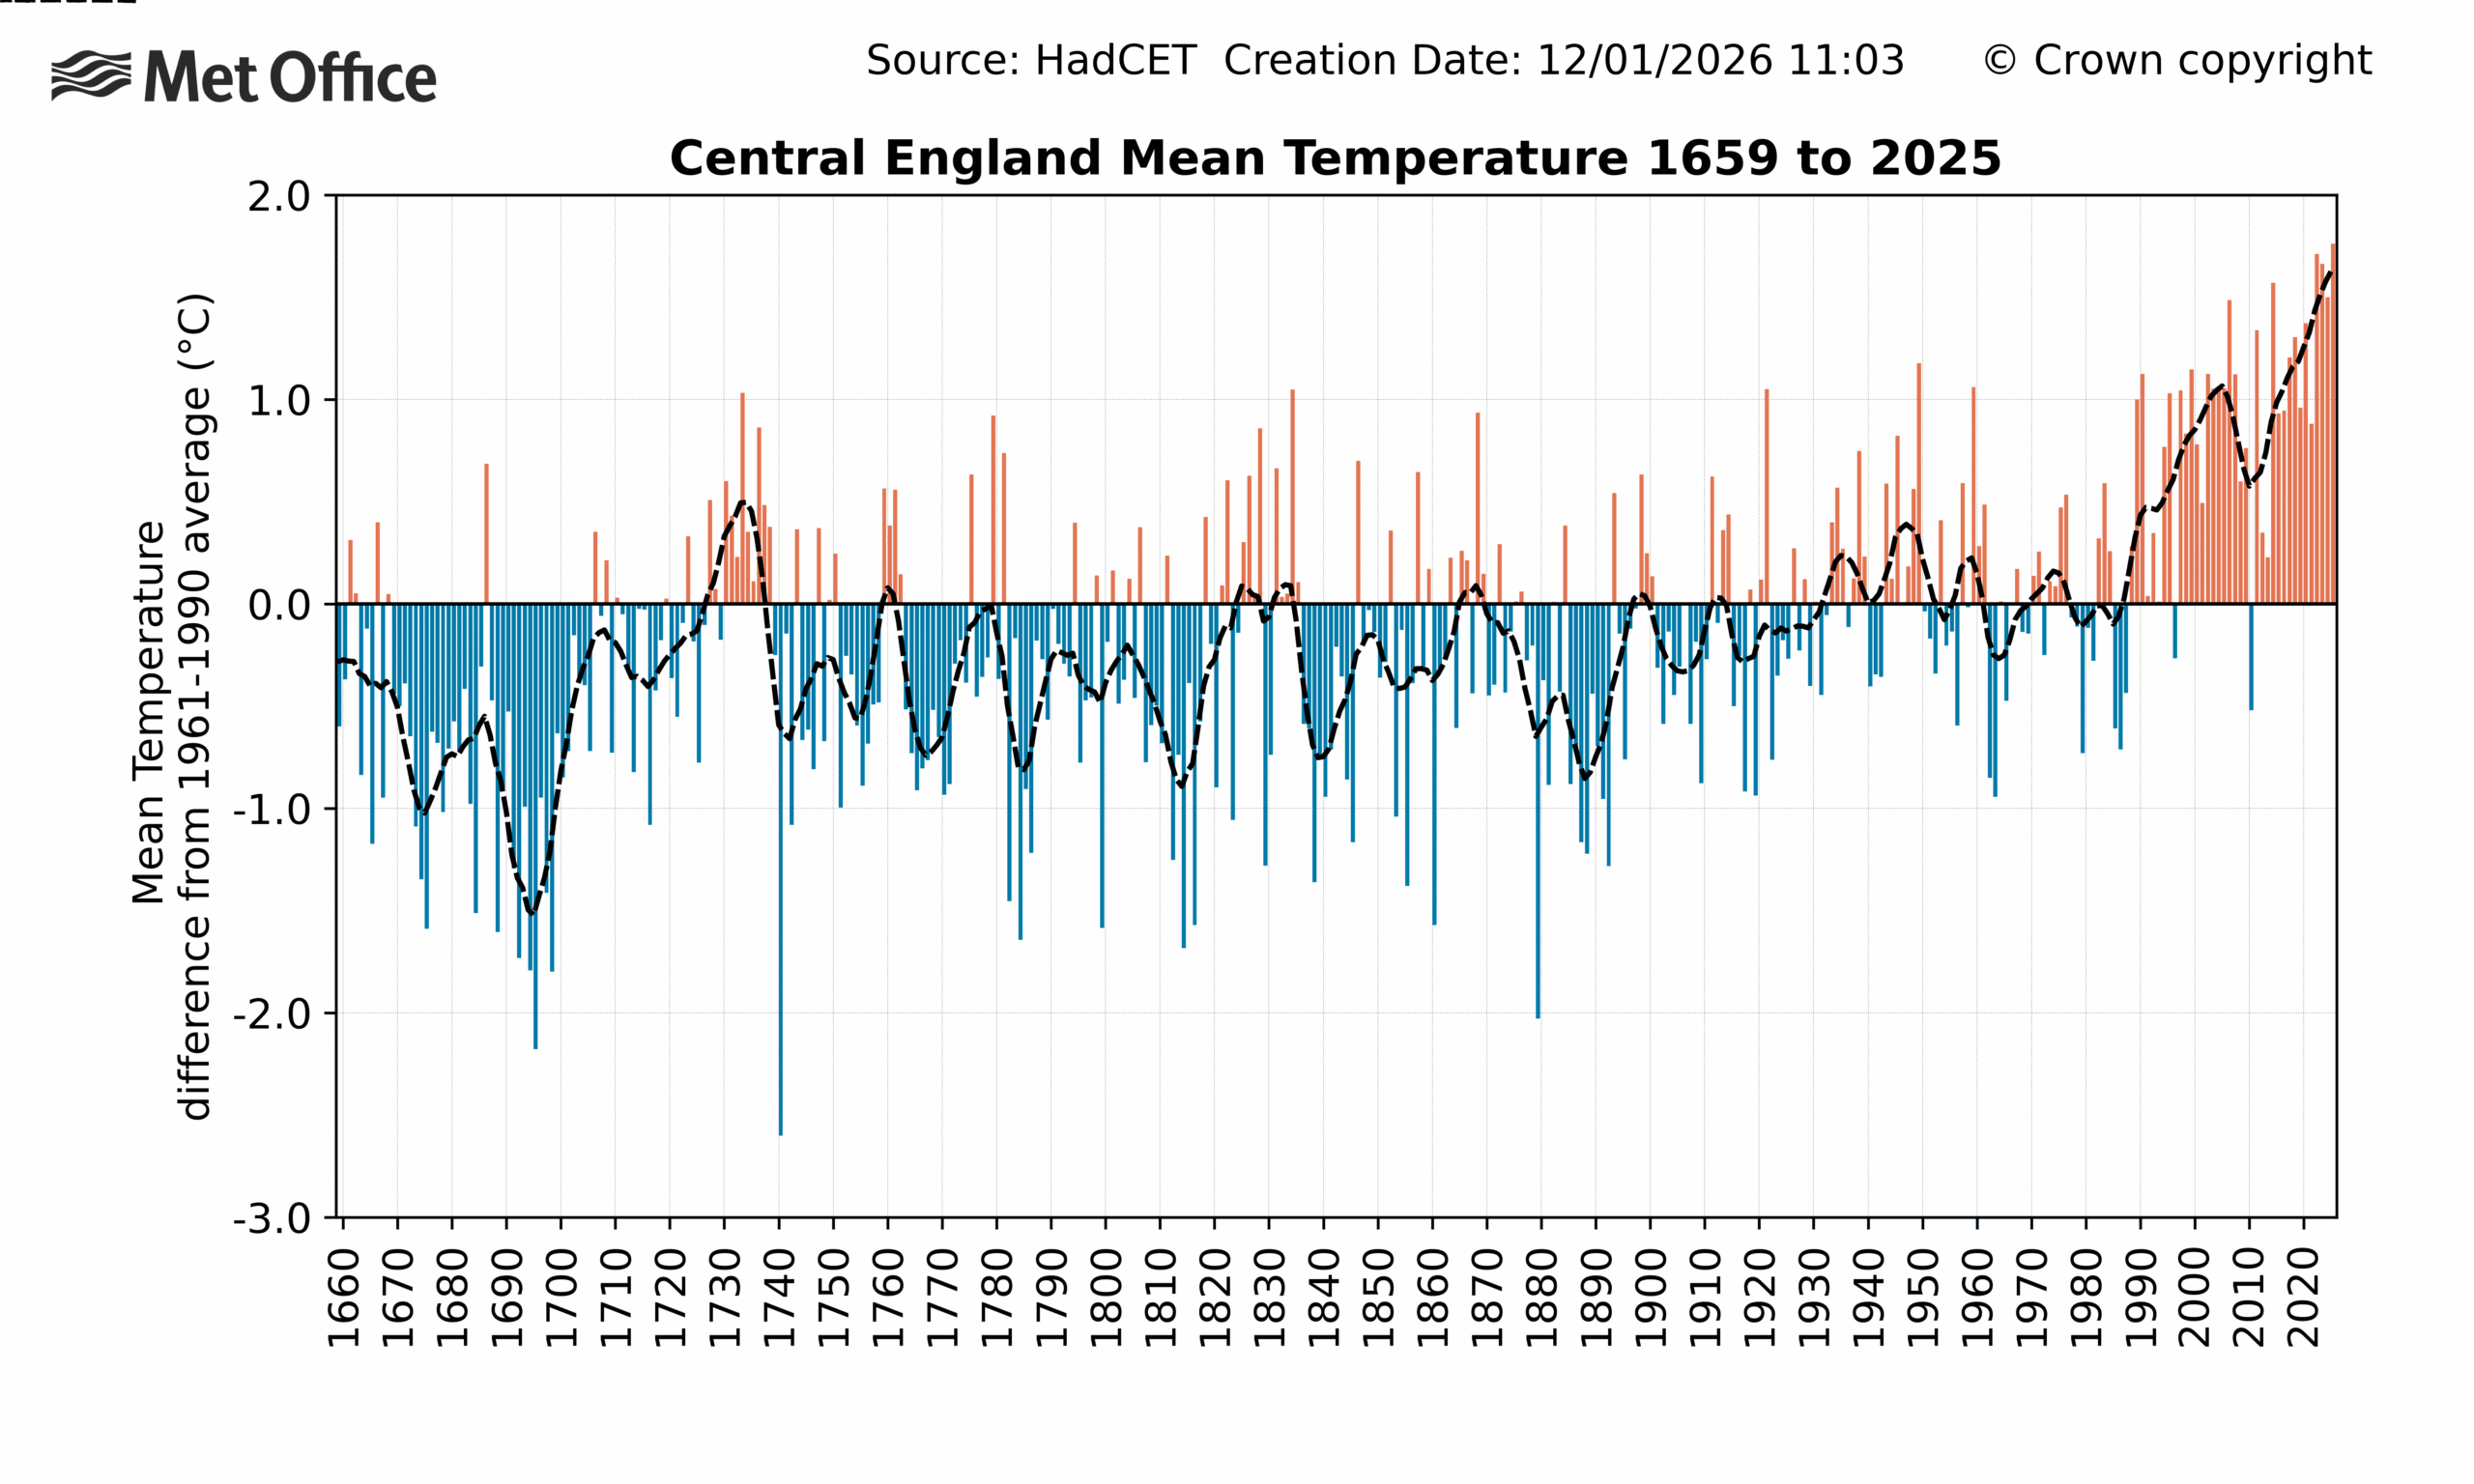
The Central England Temperature (CET) series is the longest continuous instrumental climate record in the world, dating back to 1659. Covering a region roughly enclosed by Lancashire, London and Bristol, it does not represent the whole of the UK. However, when averaged across a year and analysed across centuries, it does provide a multi-century perspective that is representative of climate variations and changes that impacted the UK.
As with the HadUK-Grid temperature record, the CET series also identifies 2025 as the warmest year on record. The longer-running temperature series identifies the same five years – in the same order – as the warmest on record. This is shown in the table below.
| Year | UK (from HadUK-Grid) | Central England Temperature |
|---|---|---|
| 2025 | 10.09C | 11.23C |
| 2022 | 10.03C | 11.18C |
| 2023 | 9.97C | 11.13C |
| 2014 | 9.88C | 11.04C |
| 2024 | 9.79C | 10.96C |
The graph below of the CET series shows that temperatures recorded in recent years are well outside the range of variability recorded over more than 300 years.
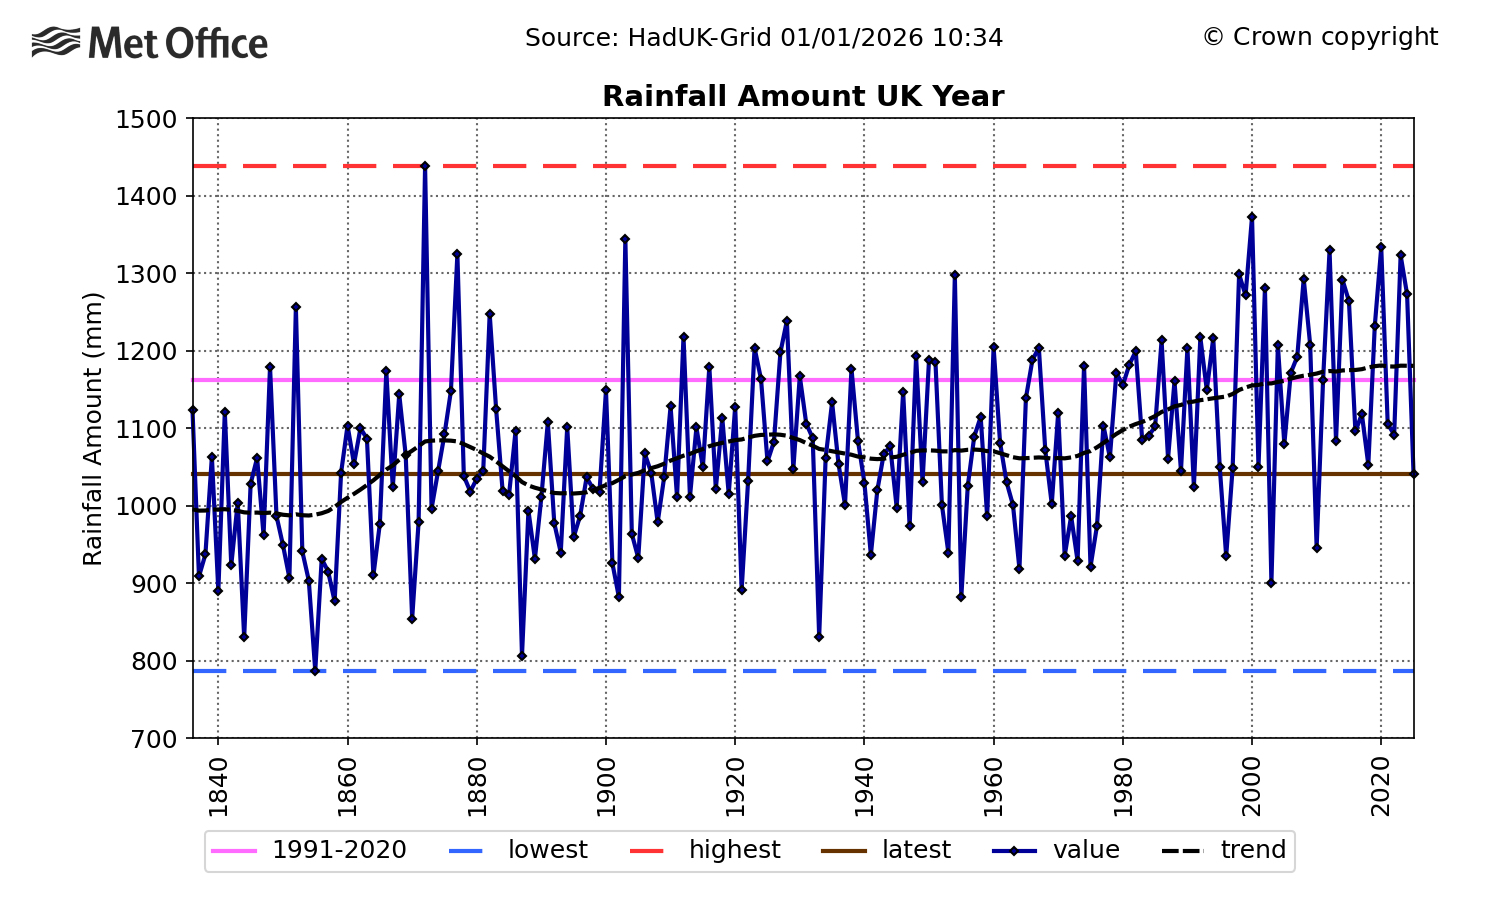
However, the UK is not only warming, it is also getting wetter and sunnier. The year 2025 was relatively dry, recording 90% of average rainfall. This made it the driest year recorded since 2010 and put it in contrast to relatively wet years in 2023 and 2024.
The longer-term trend can be seen in the figure below, which shows that 2025 was relatively dry compared to recent decades, but not exceptional in the longer-term historical context.
The last time the UK had a year in the top-10 driest was in 1955, whereas all five of the top-10 wettest years have occurred this millennium. The wettest year on record still stands as 1872.
The drivers of annual rainfall trends are more complex than for temperature.
A significant factor in rainfall trends is a warming atmosphere’s ability to hold more moisture. However, this does not completely account for recent increases in rainfall.
Large-scale atmospheric circulation patterns – particularly features such as the jet stream and associated storm tracks across the North Atlantic – also play a crucial role. These are influenced by annual and decadal fluctuations in the Earth’s climate, as well as human-caused climate change.
UK annual sunshine totals have also been rising since the 1980s, with 2025 setting a record by a considerable margin. This is in sharp contrast to 2024, which was the dullest year since 1998. This is shown in the graph below, where the dotted line shows the underlying long-term trend, with year-to-year variations removed.
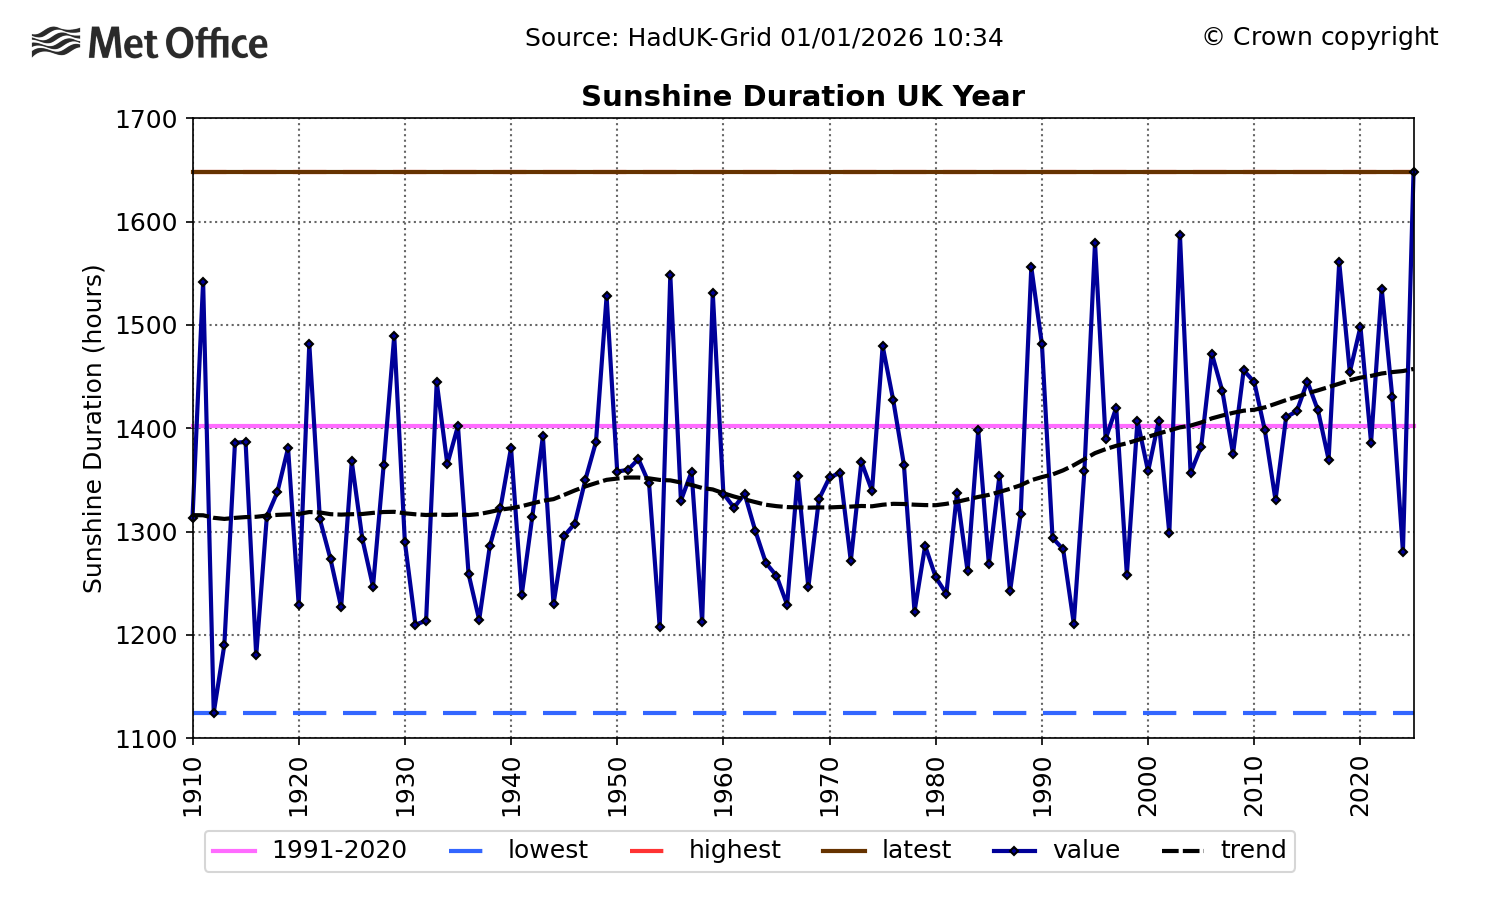
The cause of the sunshine trend is also uncertain, with both natural climate variability and human activity (through reduced regional air pollution caused by a reduction in aerosol emissions) potential contributors. Climate projections do not provide any strong evidence for how sunshine trends might develop.
§ The year in storms
The Met Office has been naming storms since 2015. Each storm-naming period runs from September to August.
(For more on storm naming in the UK, read Carbon Brief’s explainer.)
The criteria for storm naming has changed over time. It accounts for meteorological conditions, as well as the potential severity of impacts. As a result, comparisons between years can indicate relative levels of storm activity, but should not be done on a like-for-like basis.
Between the 2015-16 and 2024-25 storm seasons, there have been, on average, 7.7 named storms each year, with a high of 12 recorded in the 2023-24 season and a low of four over 2022-23. This is shown in the line chart below.
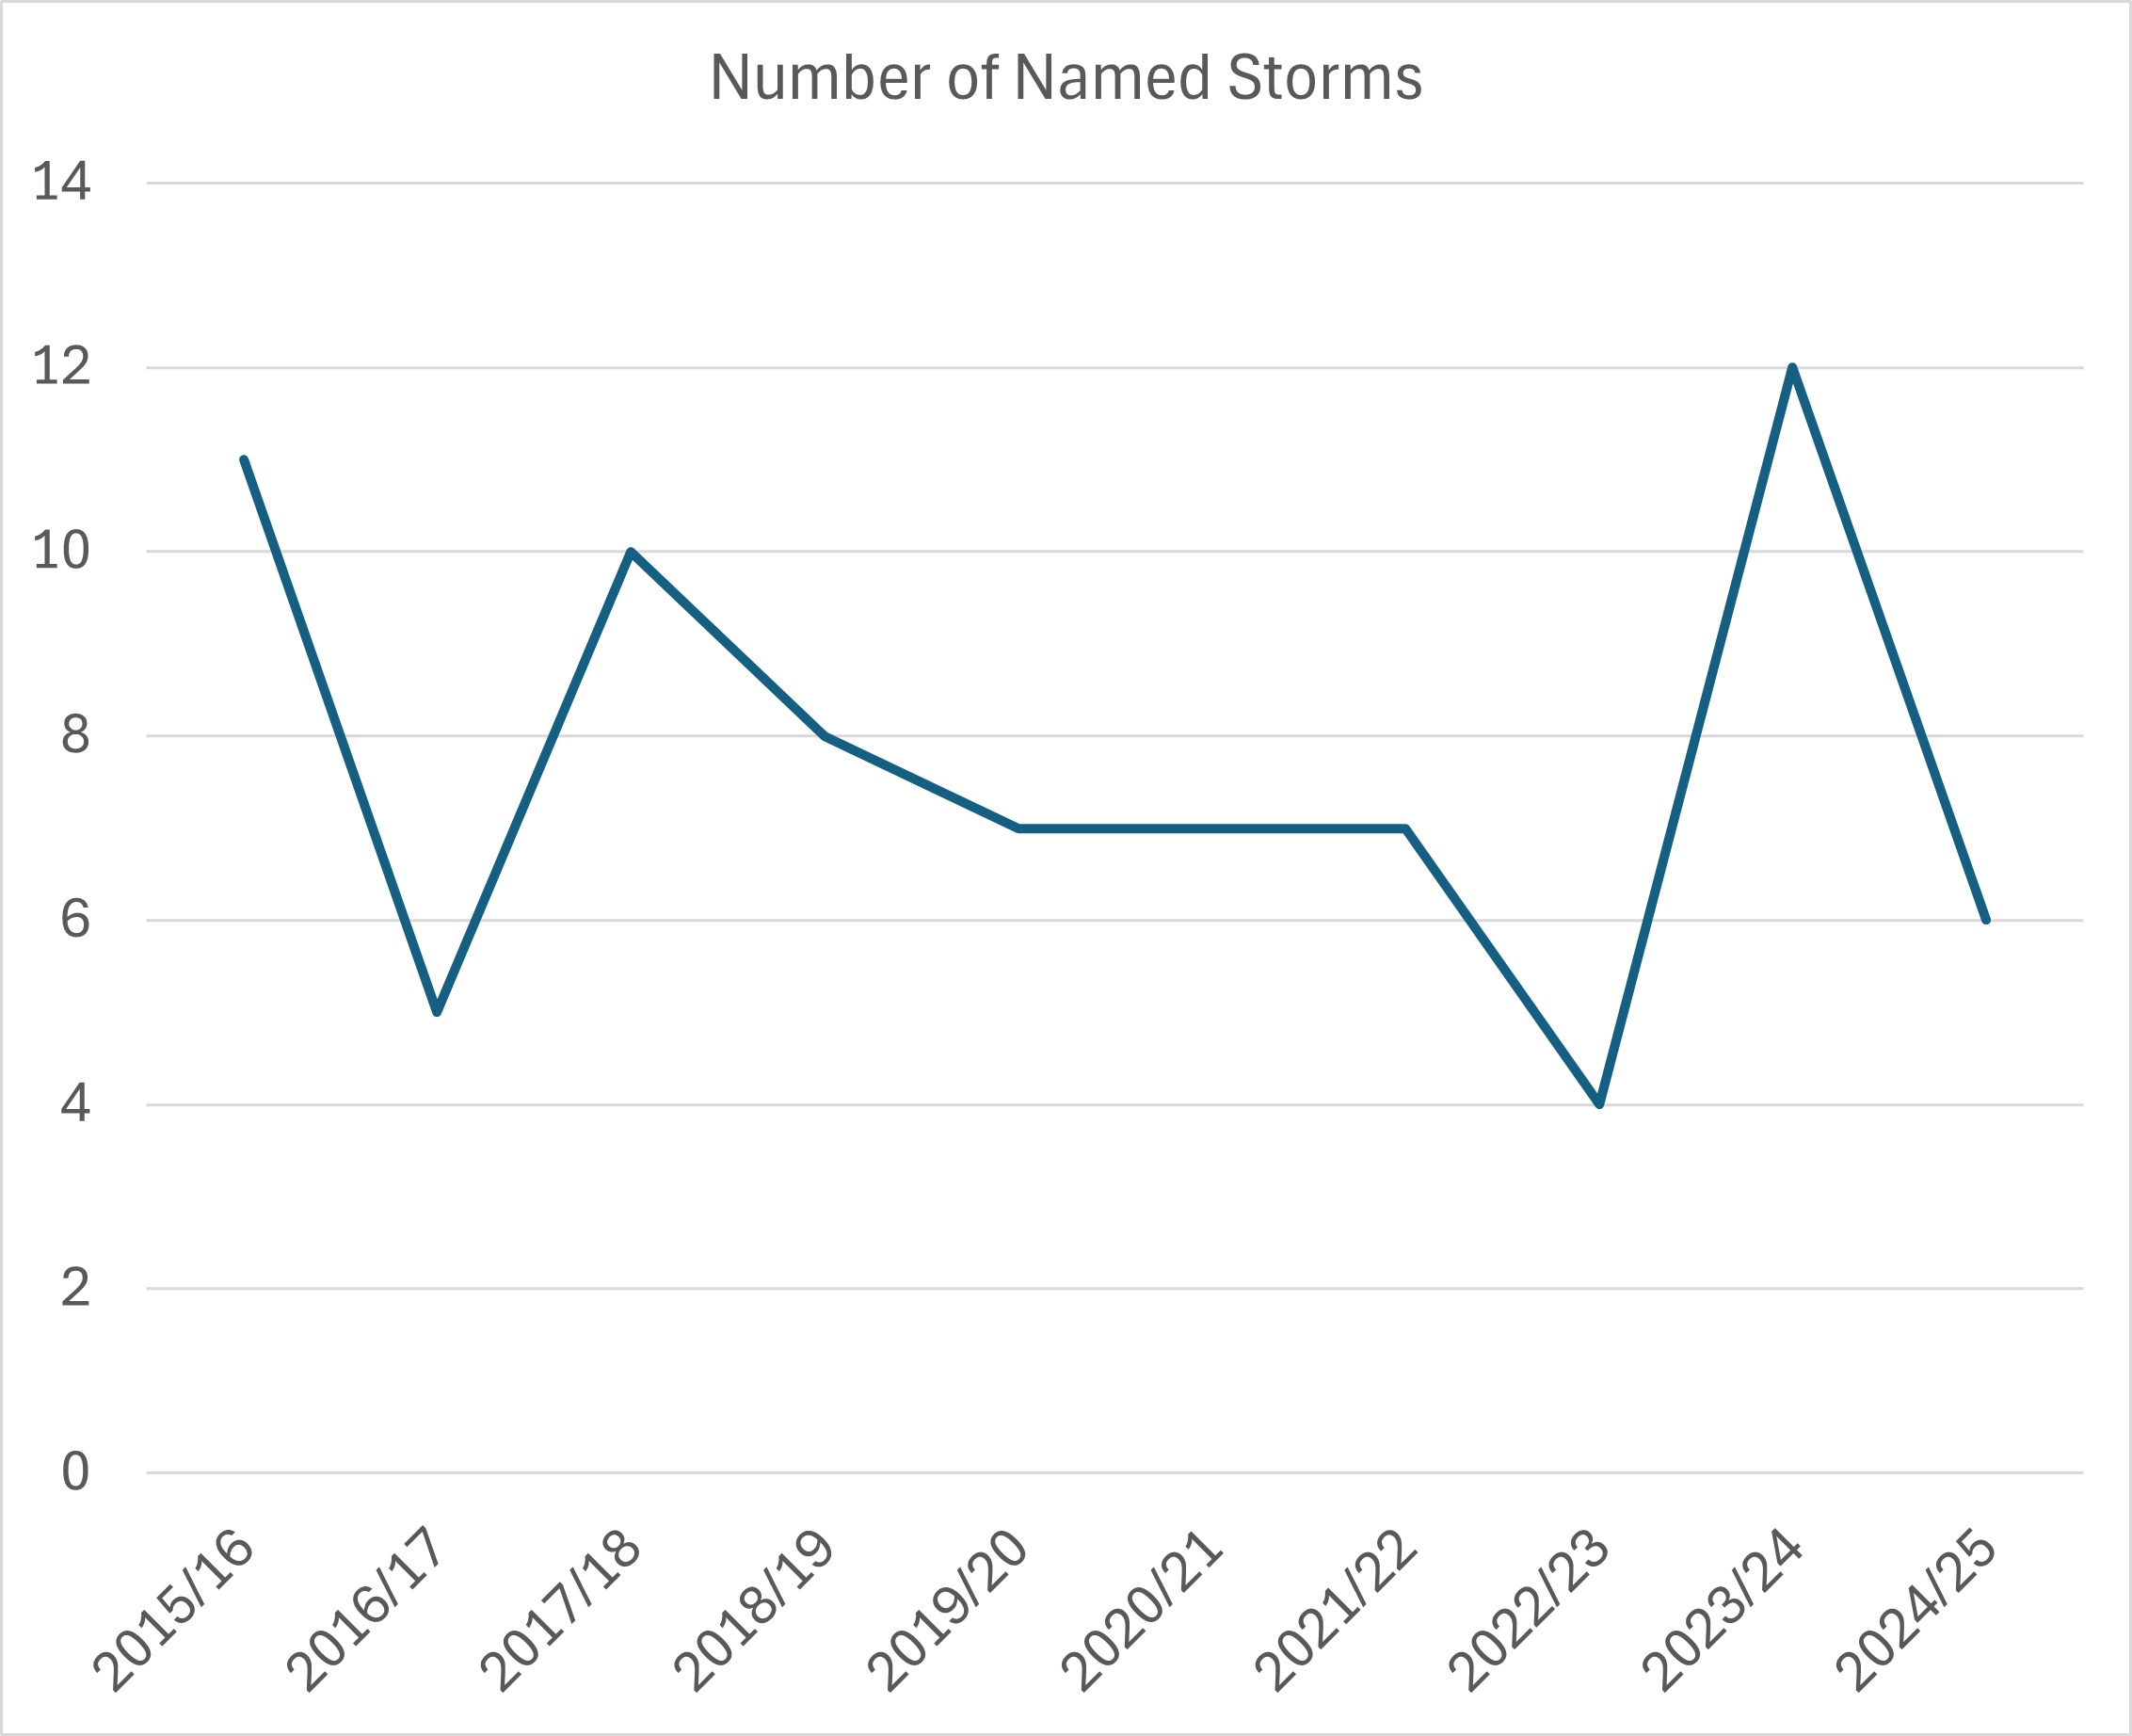
By this measure, 2025 was not exceptional with six named storms – two from the 2024-25 season and four from 2025-26. These are listed in the table below.
| Storm name | Date(s) of impact in UK | Maximum wind gust | Notable features |
|---|---|---|---|
| 2024-25 names | |||
| Éowyn | 24 January | 87Kt (100mph), Drumalbin, Lanarkshire | Most powerful storm for over a decade |
| Floris | 4-5 August | 71Kt (82mph) at Wick Airport, Caithness | Equalled Scotland’s August gust speed record |
| 2025-26 names | |||
| Amy | 3-4 October | 83Kt (96mph) at Tiree, Argyll | Significant disruption from flooding. |
| Benjamin (named by Meteo France) | 22-23 October | 52Kt (60mph) Needles, Isle Of Wight | Strongest winds affected northern France |
| Claudia (named by AEMET, Spain) | 14 November | 59Kt (68mph) Warcop Range, Cumbria | Extensive heavy rainfall across England and Wales |
| Bram | 8-10 December | 73Kt (84mph), Capel Curig, Conwy | Flooding from heavy rainfall on saturated ground. |
Credit: Met Office storm centre
Storm Éowyn in January had the most severe winds of any storm in 2025. The Met Office issued a red warning for wind across Northern Ireland and the south-west and central belt of Scotland. An amber warning was issued for the northern half of the UK. At the peak of the storm, power outages were reported at around 1m homes.
Storms from October to December were notable for bringing some persistent and heavy rain during a period of wetter weather, in contrast to the extended dry spell earlier in the year.
§ Weather through the year
The charts below show the progression of temperature and rainfall through the course of 2025.
The plot below charts average daily temperature over the course of 2025, with orange shading showing warmer-than-average conditions. Overall, the year had 244 days – 66% of the total – where temperatures were above average.
On the other hand, cold spells – indicated by blue shading – were generally short-lived and not very severe, with the exception of events in early January and November.
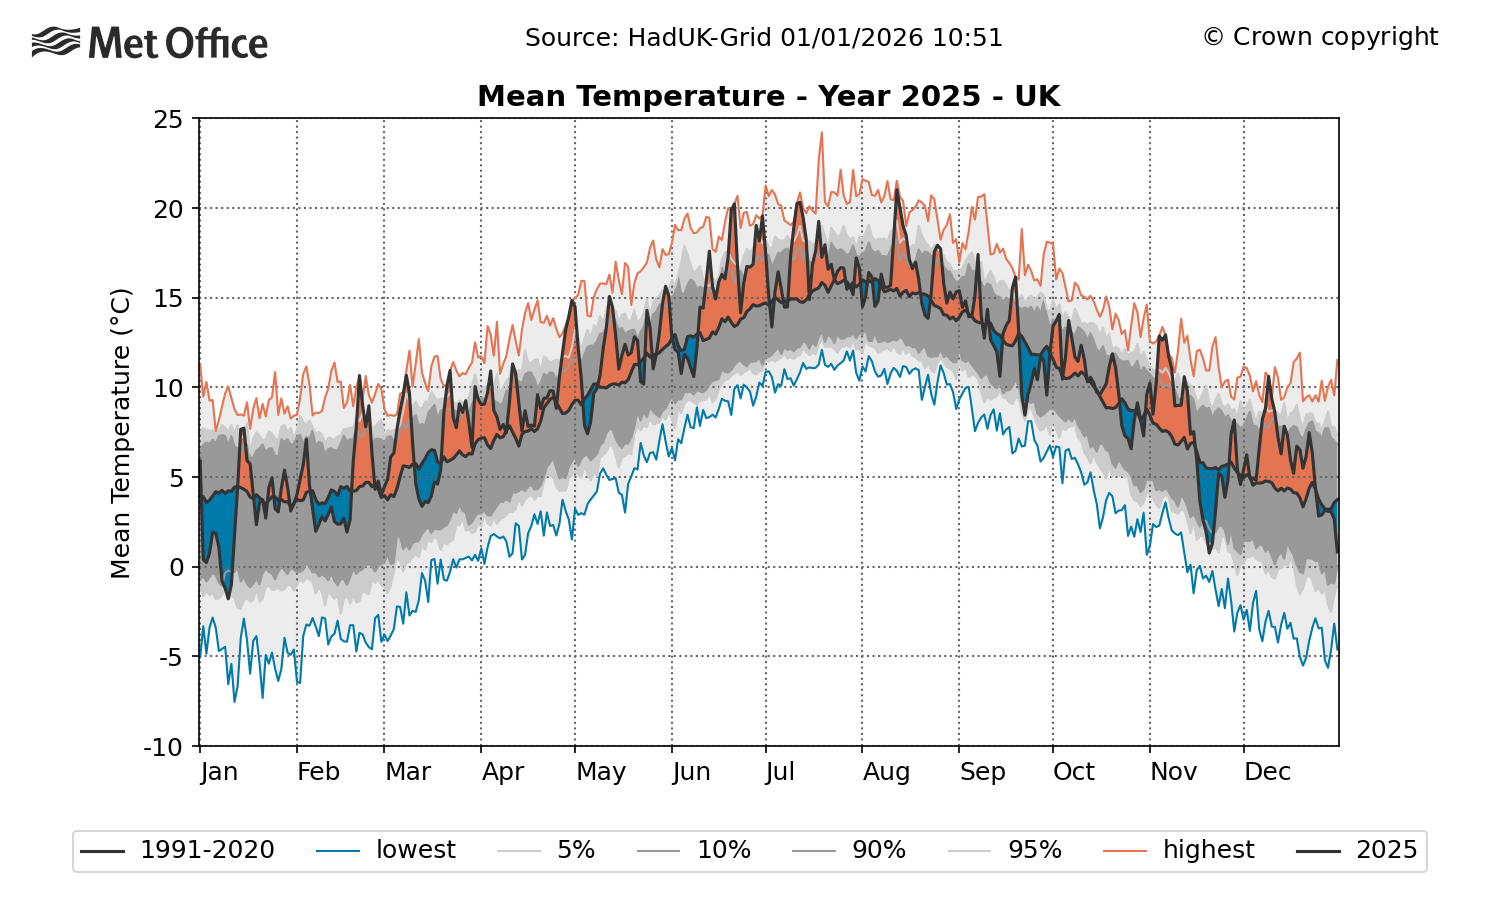
Fifty-one days in 2025 were in the top 5% warmest for the time of year in the historical record, but only one day – 20 November – was in the 5% of coldest.
The significant number of warmer days and absence of cool ones helps build a picture of how 2025 was the warmest year overall.
The highest daily maximum temperature recorded in the year was 35.8C at Faversham, Kent on 1 July during an early summer heatwave. The lowest minimum temperature was -18.9C, recorded at Altnaharra, Sutherland on 11 January.
A maximum annual temperature of 35.8C is not an exceptional high for recent years – especially when compared with 2022’s record of 40.3C. However it would have been a rare event in the 20th century, when just three years – 1932 (36.1C), 1976 (35.9C) and 1990 (37.1C) – saw a higher temperature.
In the 21st century, six years have seen temperatures above 35.8C – 2003, 2006, 2015, 2019, 2020, and 2022.
The plot below illustrates 2025’s below-average rainfall accumulation.
The brown shading – which represents the deficit in rainfall at that point of the year compared to the 1991-2020 average – highlights how rainfall totals were particularly low during the dry spring and summer period. The lower blue line shows how rainfall accumulation in 2025 came close to – but did not quite reach – a record low in late May and late August.
Wetter conditions in the autumn saw rainfall totals recover a little to reach 90% at the end of the year – which is below average, but not exceptional. As noted previously, there were regional variations.
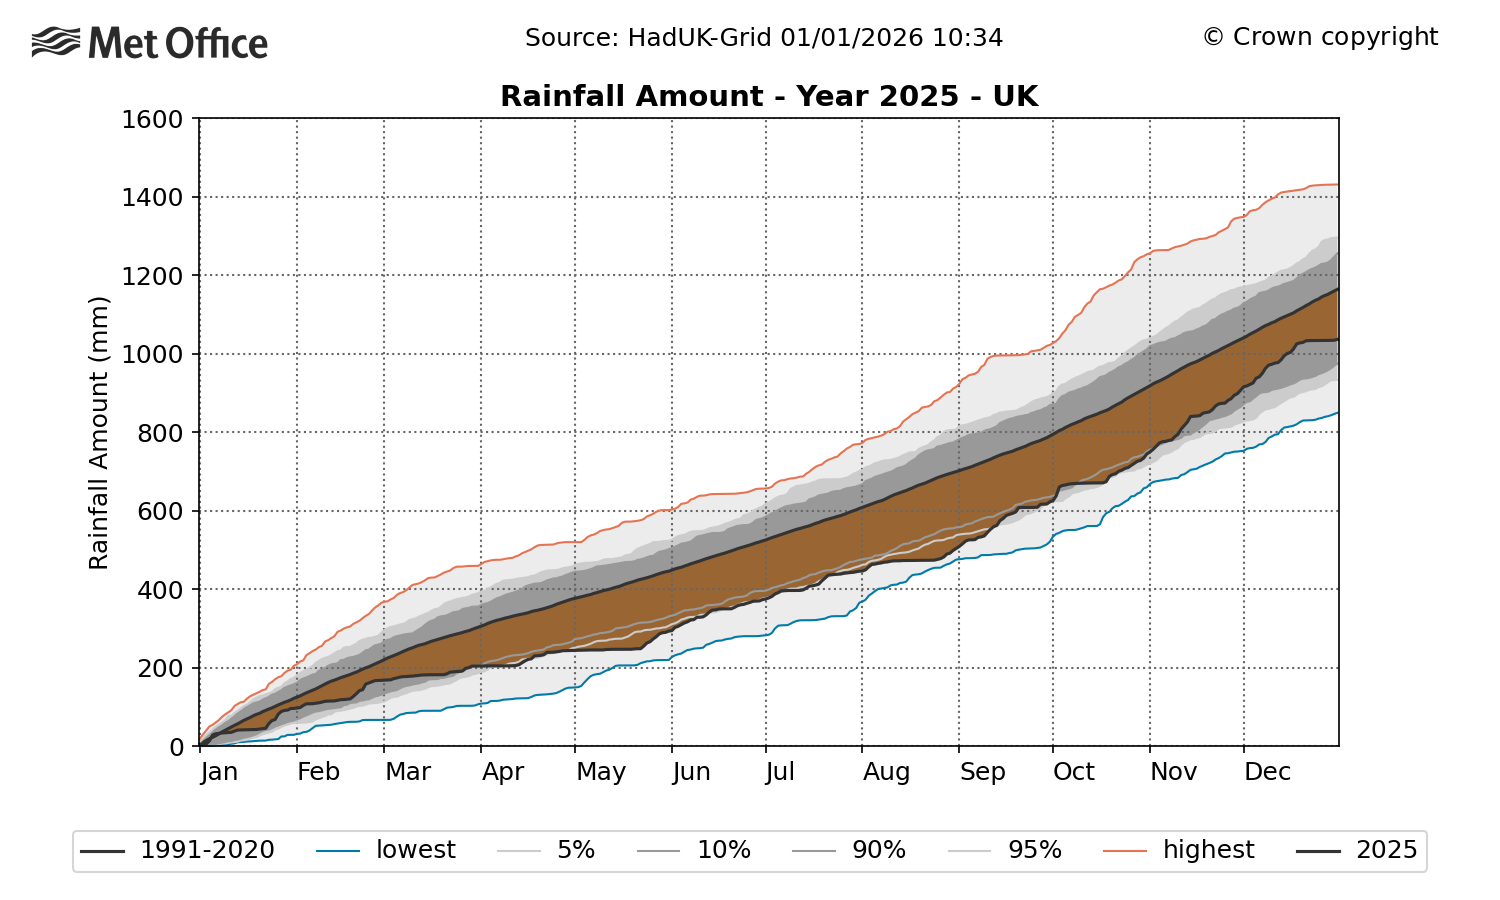
§ Winter
In climate terms, the UK winter spans the calendar months of December, January and February.
The winter of 2024-25 was slightly warmer than average, but not exceptional, with an average temperature of 4.62C. This is 0.53C above the 1991-2020 average. The winter months had 89% of average rainfall and 94% of average sunshine.
New Year’s Day saw significant flooding that affected parts of Lancashire and the south side of Manchester. The River Mersey reached record levels in the wake of two days of heavy, persistent rain.
The coldest spell of 2025 occurred in early January, with significant snowfall in some regions.
Storm Éowyn and heavy rain at the end of January were the winter’s most impactful events, bringing high winds and flooding that resulted in considerable disruption.
§ Spring
Spring – which encompasses the months of March, April and May – was the warmest and sunniest on record, as well as the sixth driest.
The record high temperature came only one year after the previous record set in 2024, continuing a trend of increasing spring time temperature for the UK.
(A Met Office attribution analysis which explored the record-breaking temperatures of May 2024 showed that the temperatures were caused by a combination of a marine heatwave which persisted through May and into June and human-induced climate change.)
The timeseries below shows average spring temperature in the UK over 1884-2025. It shows a significant warming trend since the 1970s, with temperatures in 2024 and 2025 sitting well outside the range of variability observed in the late 19th and 20th centuries.
The UK’s changing climate is having an impact on the natural cycles of many species and habitats. Citizen science initiatives have highlighted how “signs of spring” – for instance, the first flowering or first nest-building – occur increasingly early in the year.
§ Summer
Warm, sunny and dry conditions persisted into the summer season, drying out soils.
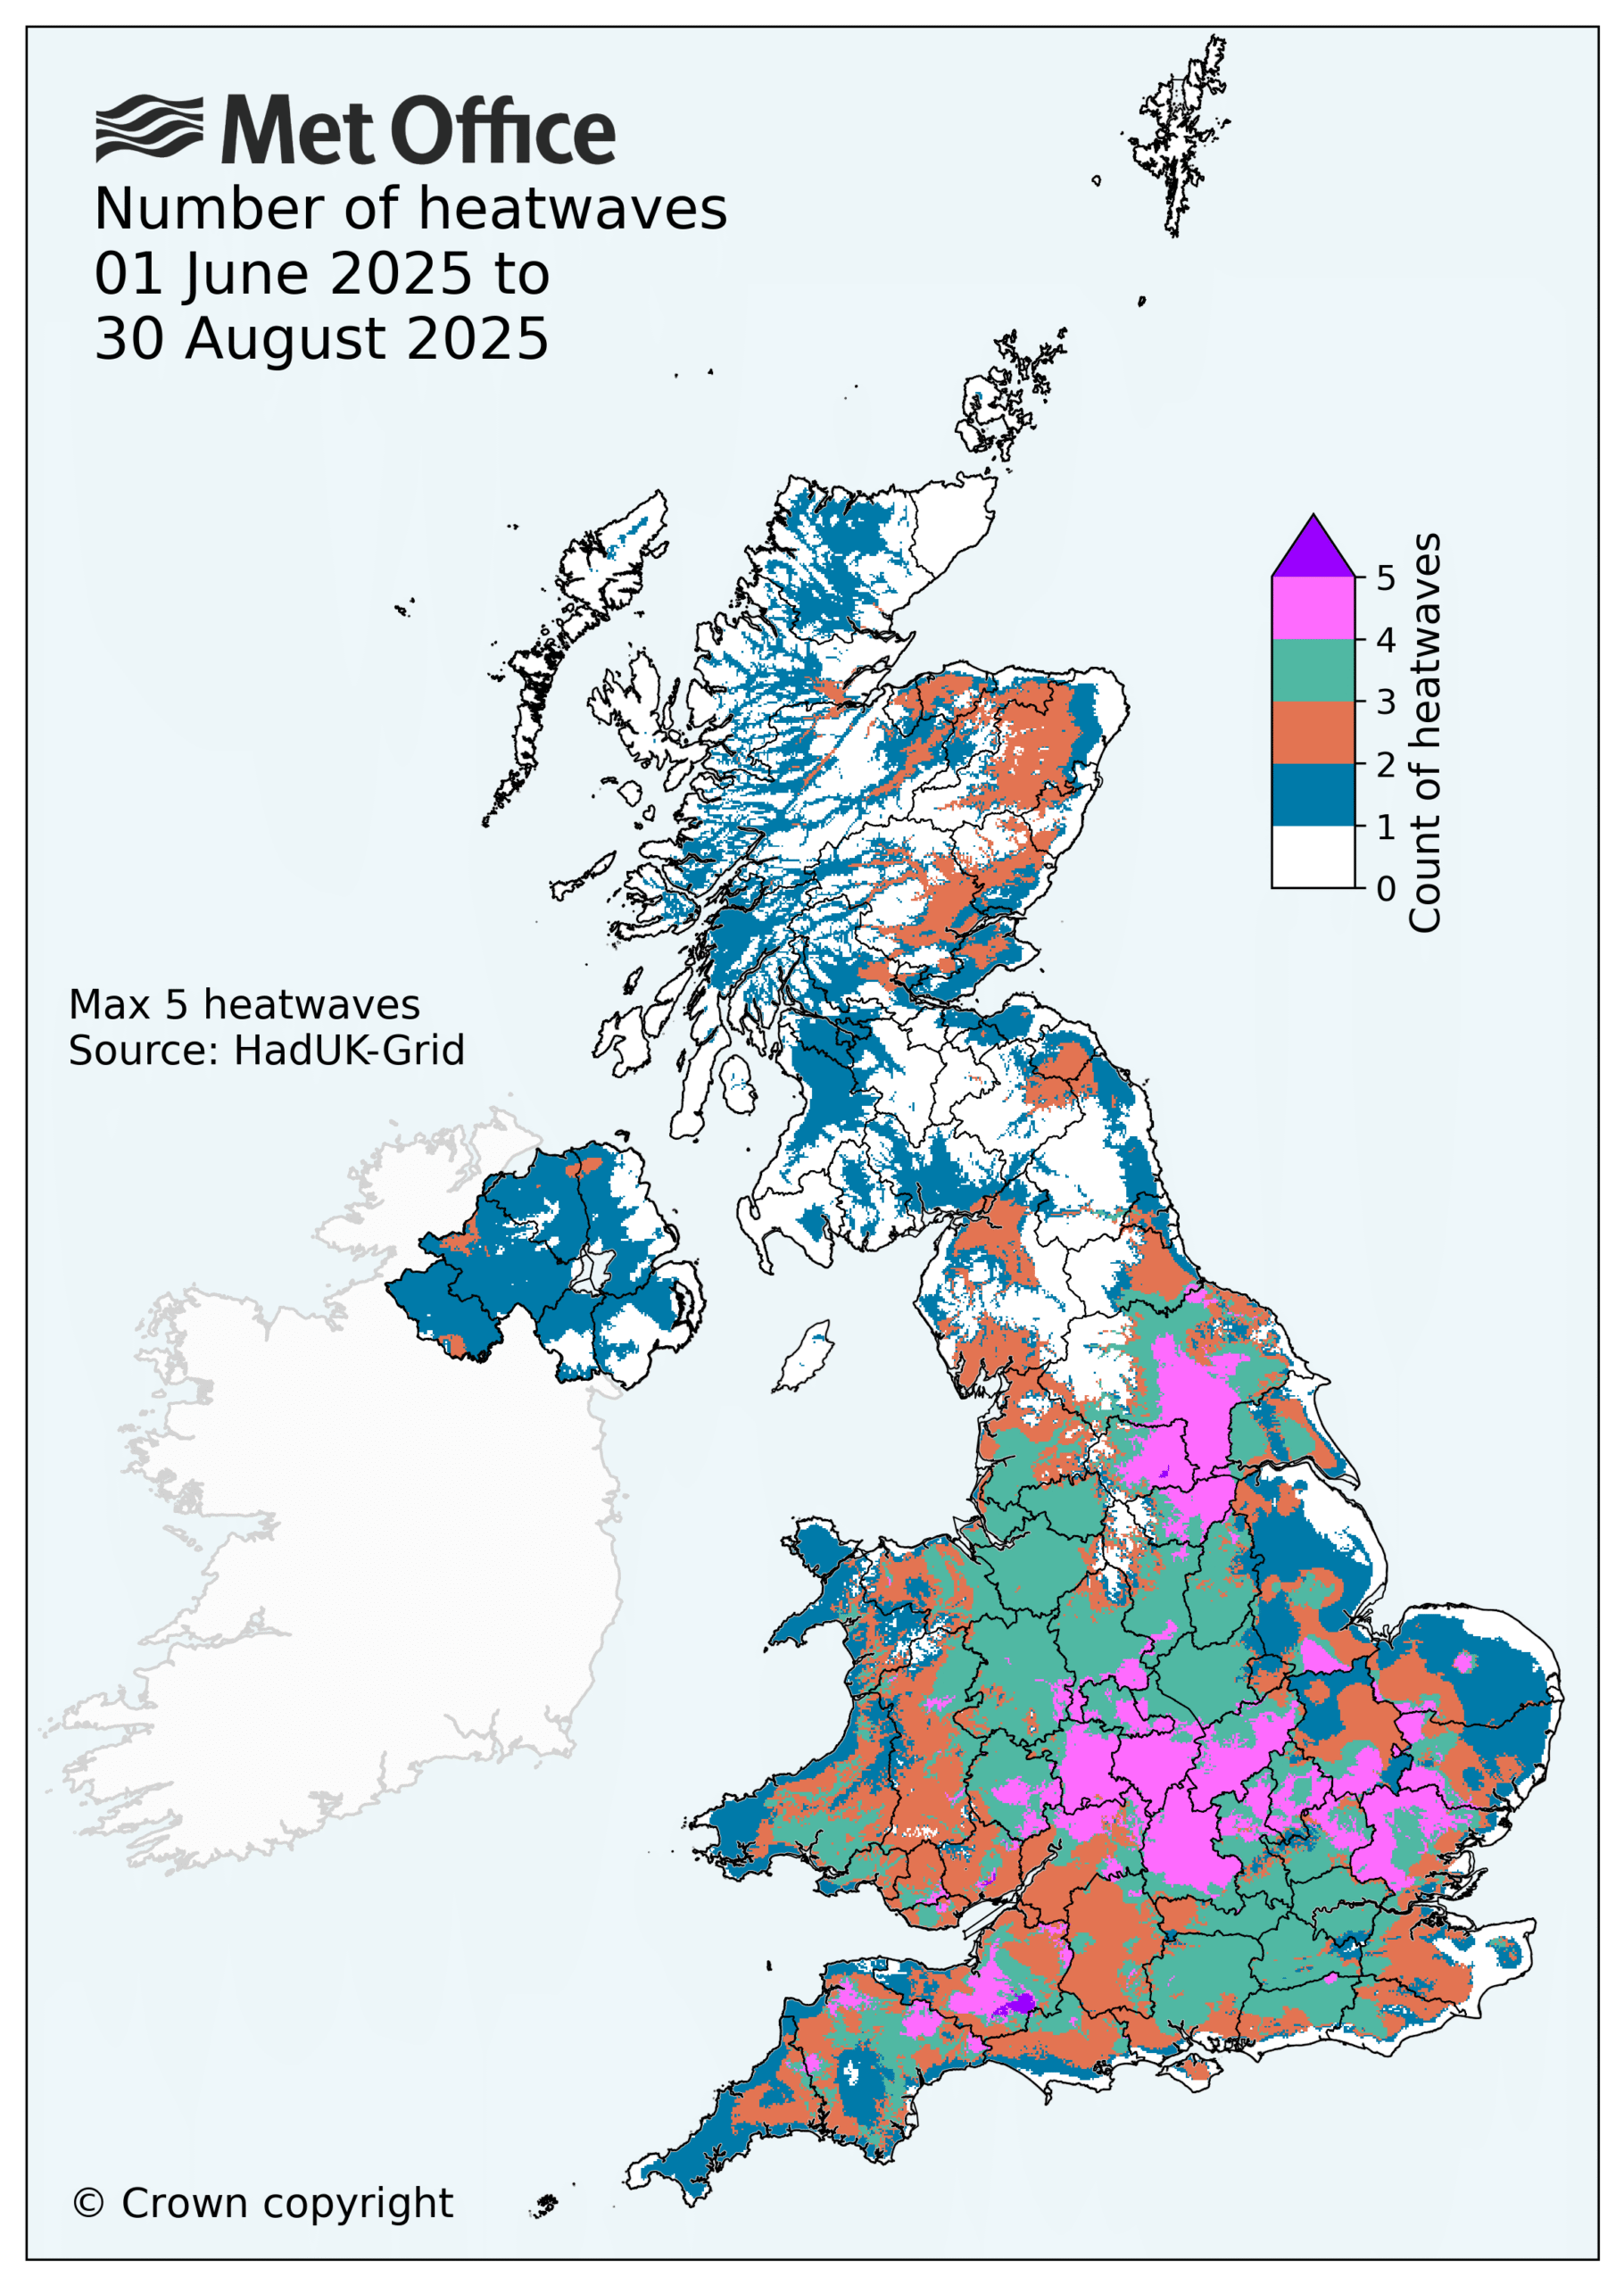
There were four heatwave events, which impacted almost all regions of the UK. Two of these events took place in June.
A marine heatwave also took place, with sea surface temperatures of 1.5-3C above the 1983-2012 average in the Celtic Sea, English Channel and southern North Sea.
An attribution study by the World Weather Attribution service estimated that human-caused climate change had made exceeding June heatwave thresholds around 10 times more likely. The research also found that one of the June heatwaves had been made 2-4C more intense as a result of human influence.
The five warmest summers recorded in the UK to date are 2025 (16.10C), 2018 (15.76C), 2006 (15.75C), 2003 (15.74C) and 2022 (15.71C).
Met Office analysis estimates that in a pre-industrial climate, a summer like 2025 would be expected to occur every 340 years. However, in the current climate, we could expect to see these sorts of summers roughly once every five years.
The study also shows that the UK could plausibly experience much hotter summers in the current and future climate. Events that would have been seen as extremes in the past are becoming more common.
A Met Office attribution study published in 2019 estimated that the then record-breaking summer of 2018 had a statistical return period of approximately eight-to-nine years. The summer of 2025 has broken that record in seven years, consistent with these previous findings.
The science is clear that UK summers are becoming warmer and extreme heat events are becoming more common. This could mean more significant impacts on people, infrastructure and the environment – both now and in the future.
The map below plots the number of heatwaves that took place in June, July and August across the UK. It shows how a significant number of regions across saw three (green shading) or four (pink shading) heatwaves over the summer months.
§ Autumn
Autumn and the month of December were marked with unsettled weather, with mild and wet conditions over the four-month period.
The season was warmer and wetter than average. Northern Ireland had its third-wettest autumn on record, Northern England its fifth wettest and Wales its 10th wettest.
Storm Amy set a record for highest gust speed for a storm in October, with 80Kt (92mph) recorded at Magilligan, County Londonderry.
Other major storms were notable for heavy rainfall that caused flooding. Storm Claudia brought heavy rainfall to central England and Wales in mid-November, which fell on already saturated ground.
The second half of November saw snow cause across the North York Moors during a cold northerly spell which saw some hard frosts. This was followed by generally mild and unsettled conditions until late December, when strong easterly winds brought more low temperatures and hard frosts.
The UK chalked up a number of significant climate records in 2025, particularly for high temperatures. This aligns with the well-established warming trend that is the result of human-caused climate change.
Climate attribution studies continue to provide further evidence that human factors are increasing the likelihood and severity of UK climate extremes.
Many of 2025’s records will not stand for long. There is a high chance they will be broken again in the near future as the climate continues to warm.