Analysis: Fossil-fuel CO2 emissions set to dip in 2026 as Iran conflict hits oil use
Carbon dioxide (CO2) emissions from fossil fuels and cement are projected to fall by around 0.4% in 2026 to 38.2bn tonnes of CO2 (GtCO2), according to new figures from the Global Carbon Project.
This guest post is by:
- Dr Zeke Hausfather, Carbon Brief’s climate science contributor
- Prof Pierre Friedlingstein, chair of mathematical modelling of climate systems at the University of Exeter and part of the Global Carbon Project team.
The 21st edition of the annual “global carbon budget” report, published today, says that this small decline is largely due to a 1.9% drop in emissions from oil and the energy shock triggered by the Iran conflict and the closure of the strait of Hormuz.
Emissions from coal continue to increase slightly.
The Global Carbon Project’s projections for fossil fuel and cement CO2 emissions in 2026 are preliminary, with a range that spans a fall of -1.5% to a rise of +0.6%.
This means a small increase in emissions can not be ruled out.
Emissions from land-use change, such as deforestation, are projected to rise in 2026.
This is primarily driven by peat fires and forest degradation in south-east Asia and is linked to the development of a strong El Niño event this year.
As a result, total CO2 emissions from fossil fuels and land use are projected to reach a record high of 43.3GtCO2 in 2026 – marginally above 42.8GtCO2 in 2025.
Research published alongside the report by the same team in Nature Climate Change finds that the growth in solar, wind and electric vehicles (EVs) now offsets around two-thirds of the emissions that would otherwise come from rising energy demand.
However, the deployment of these technologies is not yet enough to push global emissions into a sustained decline, according to the study.
The 2026 global carbon budget report also estimates that:
- Fossil emissions are projected to fall in China (-0.9%), the US (-1.3%) and the EU (-1.5%) in 2026, but rise by 4.4% in India.
- Oil emissions are projected to fall in every major region, with the largest drop in China (-4.6%).
- Land-use emissions averaged 4.9GtCO2 per year over 2016-25, around 21% lower than the decade before.
- Total CO2 emissions (fossil and land-use) grew by an average 0.3% per year over the past decade (2016-25), compared with 1.7% per year over the decade before.
- The remaining carbon budget to limit warming to 1.5C is 150GtCO2, or less than four years of current emissions.
- The land sink in 2025 was the highest on record, rebounding after being weakened during the 2023-24 El Niño. The current El Niño is expected to weaken the land sink in 2027.
- The concentration of CO2 in the atmosphere is set to reach 427.7 parts per million (ppm) in 2026, 54% above pre-industrial levels.
(For more on previous editions of the Global Carbon Project’s annual report, see Carbon Brief’s coverage in 2025, 2024, 2023 and 2022.)
§ Total emissions edge up as land-use emissions rise
Total global CO2 emissions, which combines fossil fuels and land-use change, are projected to reach a record high of 43.3GtCO2 in 2026, up from 42.8GtCO2 in 2025.
The increase in 2026 comes entirely from a projected rise in land-use emissions, which are more challenging to estimate than fossil emissions.
(The global carbon budget groups emissions from fossil fuels and cement production as “fossil emissions”. Carbon Brief follows this convention throughout this piece.)
If land-use emissions had stayed at 2025 levels, total emissions would have fallen slightly in 2026 to around 42.6GtCO2.
Each edition of the global carbon budget updates the historical record as new data and methods become available. The chart below shows total emissions in this year’s budget compared with the five previous editions.
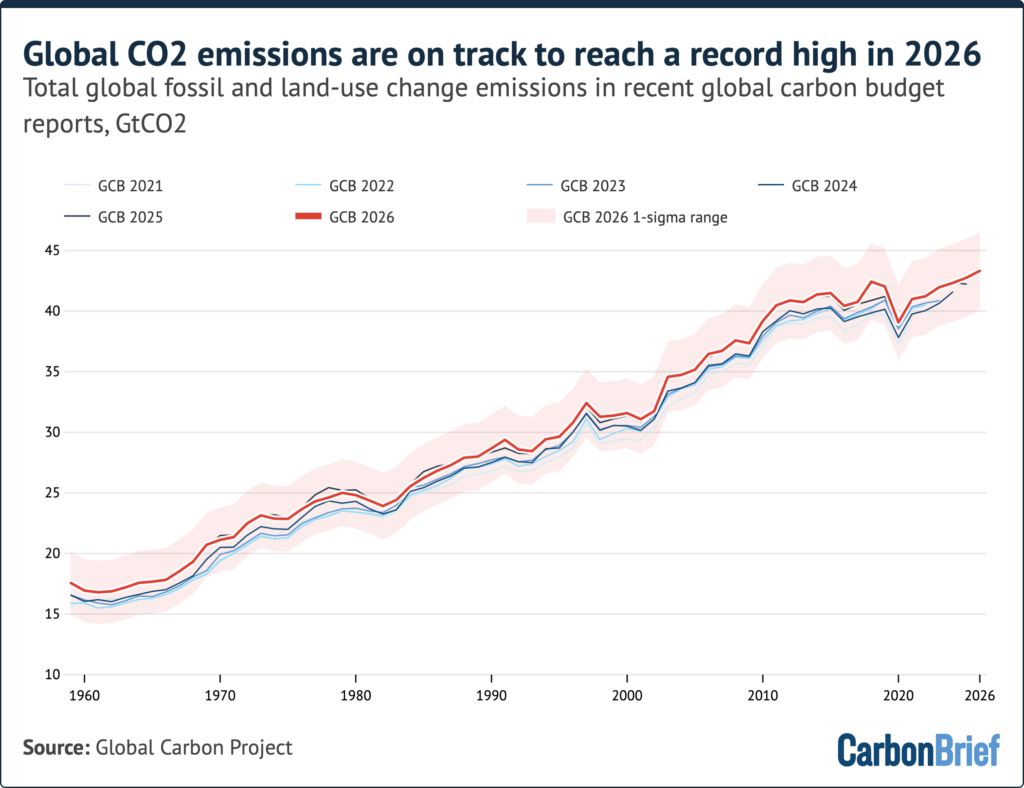
This year’s estimates of historical fossil emissions are around 0.3GtCO2 per year higher than in last year’s budget.
This is largely because the report now estimates a smaller “cement carbonation” sink in the wake of research published this year in Communications Sustainability. In other words, it estimates that cement is able to slowly reabsorb less CO2 over its lifetime than previously thought.
Estimates of land-use emissions have also been revised, including a spike in 2018 – visible in the chart above – linked to updated cropland data for Colombia.
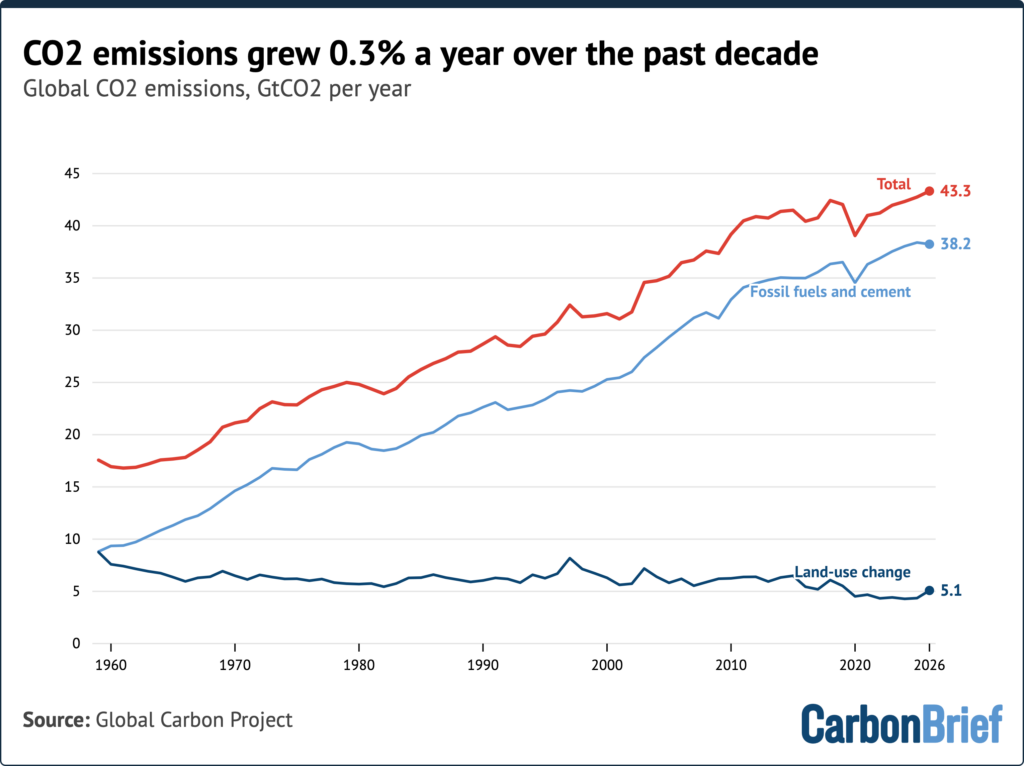
The updated numbers show that total emissions have grown by 0.3% per year over the past decade (2016-25), compared with 1.7% per year over 2006-15.
Fossil emissions grew about 0.9% per year in the past decade, compared with 1.9% the decade before. Over the same period, land-use emissions have declined.
While the slowdown reflects real progress, a plateau in emissions is still a long way from the rapid declines needed to reach net-zero emissions and stabilise global temperatures.
With human-caused warming reaching 1.37C above pre-industrial levels (1850-1900) in 2025, the report estimates that the remaining carbon budget to limit warming to 1.5C, with a 50% chance, is 150GtCO2 from the start of 2027. That is less than four years of 2026 emissions.
Meanwhile, the budgets for 1.7C and 2C are 510GtCO2 and 1,035GtCO2, respectively – or around 12 and 24 years of current emissions.
Fossil emissions made up around 88% of total CO2 emissions over the past decade, with land-use change making up the remaining 12%.
This is a marked change from the first half of the 20th century, when land-use emissions were larger than those from fossil fuels.
The figure below shows global emissions, split into fossil and land-use components.
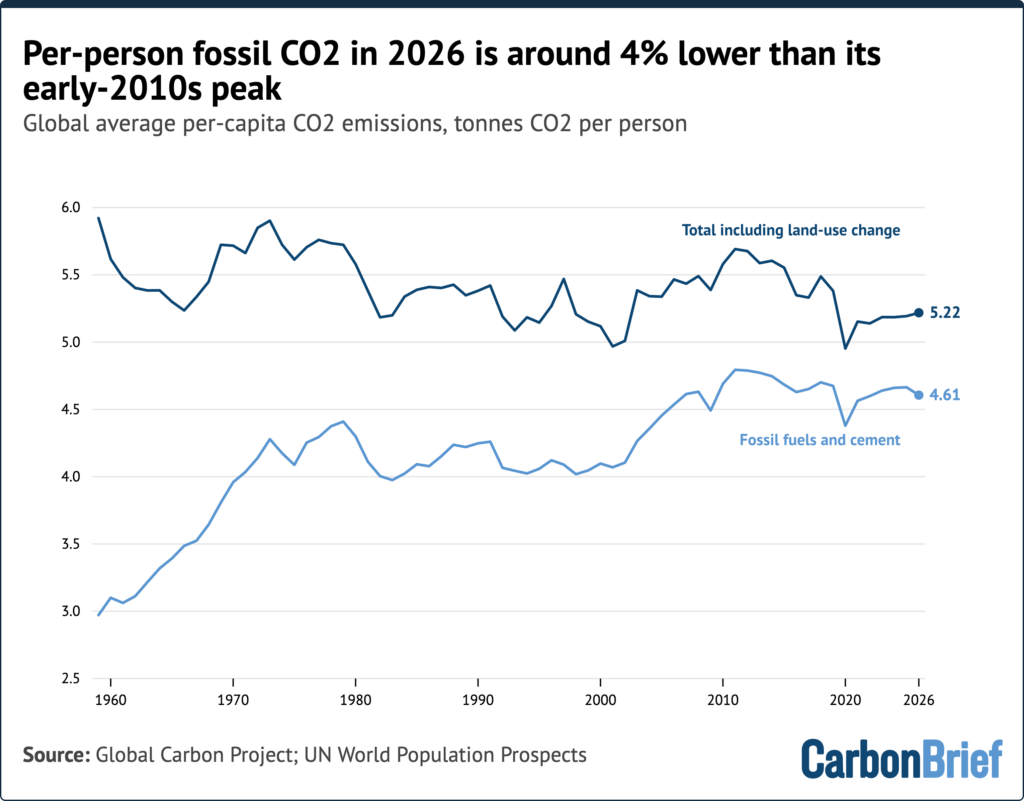
Global per-capita fossil emissions peaked in the early 2010s and have since slightly declined. At around 4.6 tonnes per person in 2026, they are about 4% below that peak.
It is worth noting that this global average hides very large differences between countries. For example, 2025 per-capita emissions in India are only 2.2 tonnes, compared with 14.5 tonnes in the US.
§ Land-use emissions rise in 2026
Land-use emissions come from deforestation, forest degradation, wood harvest, peatland drainage and fires. They are partly offset by forest regrowth and new forests.
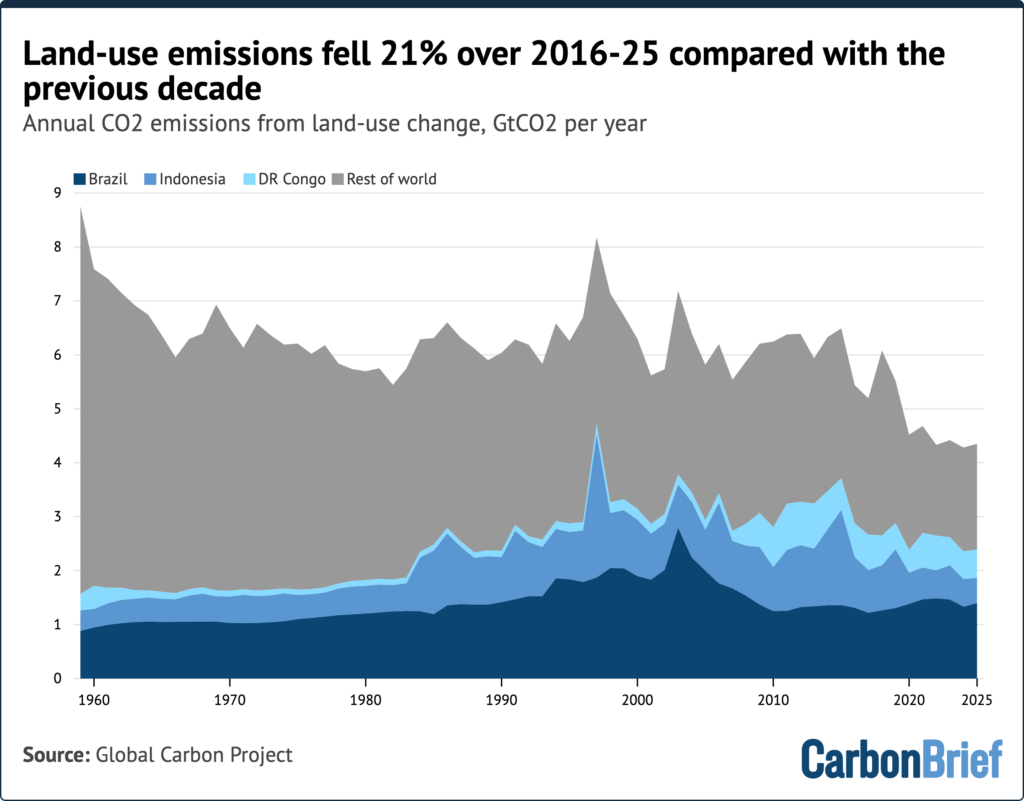
Net land-use emissions averaged 4.9GtCO2 per year over 2016-25, down from 6.2GtCO2 per year over 2006-15, marking a decline of around 21%. This decline holds across all three of the “bookkeeping” models used by the Global Carbon Project to track land-use emissions.
(For more on trends in global land-use emissions and how they are calculated, see Carbon Brief’s explainer.)
Land-use emissions are projected to rise to 5.1GtCO2 in 2026, up from 4.4GtCO2 in 2025.
The report attributes the increase to peat fires, almost all ignited by people, and forest degradation in south-east Asia due to drier conditions associated with El Niño.
Uncertainties in land-use emissions are much higher than for fossil emissions given the challenges in tracking them.
While 2026 shows a nominal increase, it is only slightly above the average over the past decade.
Brazil, the Democratic Republic of the Congo (DRC) and Indonesia together accounted for 2.6GtCO2 of land-use emissions per year over 2015-25, or around 54% of the global total.
The figure below shows how land-use emissions for these three countries and the rest of the world have changed since 1960.
§ Fossil emissions fall in most major economies
Global fossil CO2 emissions are projected to fall by around 0.4% in 2026. However, challenges associated with precisely measuring and projecting 2026 means this could end up anywhere between a 1.5% decline and a 0.6% increase.
The figure below provides a breakdown of fossil emissions over time by major country and region, including China, the US, the EU, India and the rest of the world.
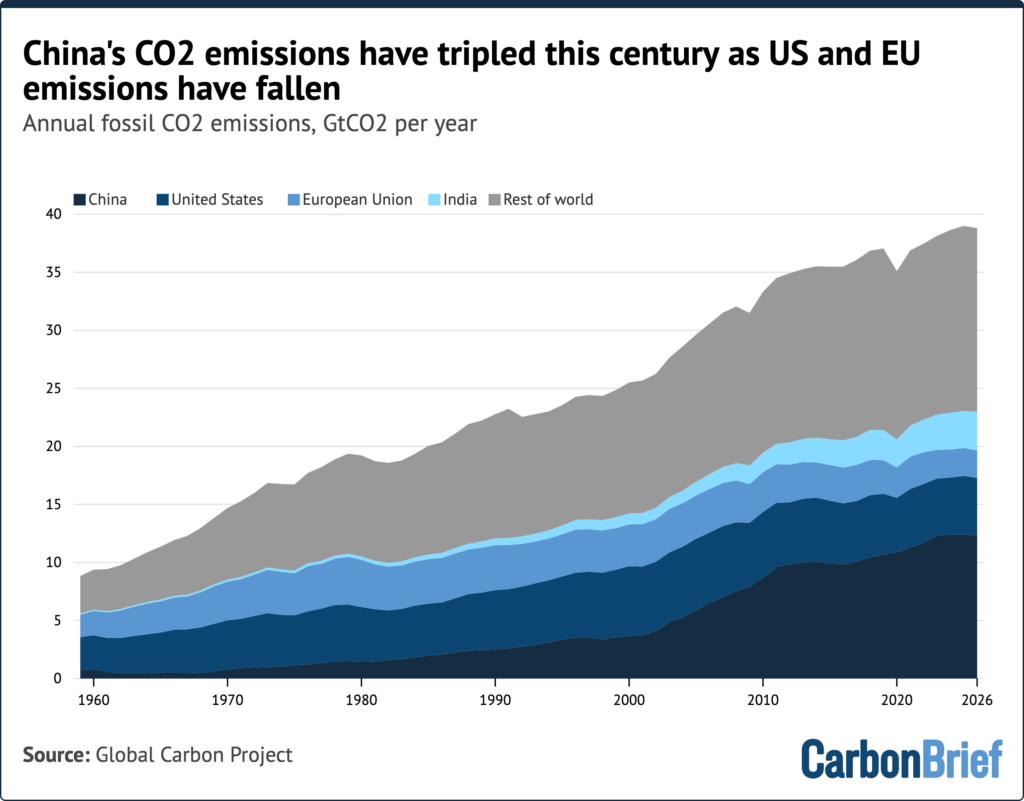
The global carbon budget report sets out the following projections for 2026 in major economies:
The figure below shows how each country or region contributed to changes in global fossil emissions in each year between 2023 and 2026.
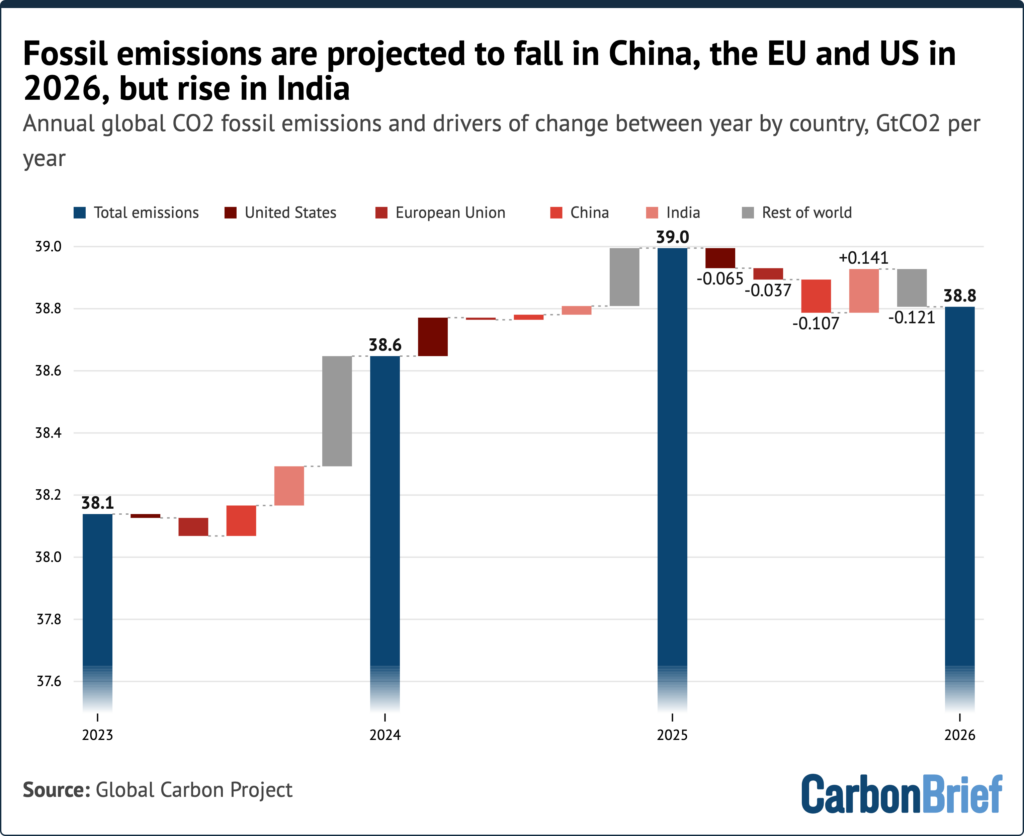
A growing number of countries are cutting emissions while growing their economies.
The report finds that 40 countries, together accounting for 26% of global fossil emissions, significantly reduced their emissions while their economies grew over 2016-25. This compares with 22 countries in the previous decade.
§ Oil emissions fall as coal emissions slightly increase
Coal accounts for around 41% of global fossil CO2 emissions in 2026, oil 33% and gas 21%. Cement accounts for around 2%, after the carbonation sink is subtracted.
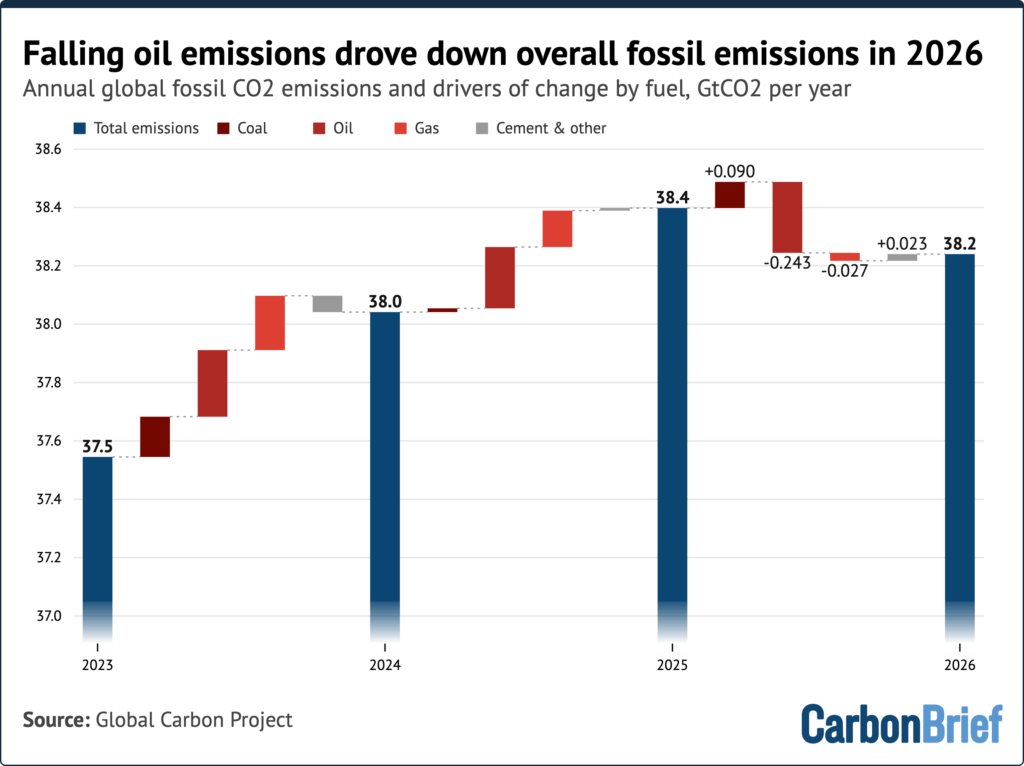
Oil is the main driver of the decline in global fossil emissions in 2026. Oil emissions are projected to fall by 1.9% (with a range of -2.6% to -1.2%), or 243m tonnes of CO2 (MtCO2).
The left panel of the figure below shows that this is one of the largest annual falls in the record, with the exception of 2020 during the Covid-19 pandemic. Other large declines occurred during the global financial crisis in 2009 and in the dissolution of the Soviet Union in 1992.
The chart on the right shows how oil emissions are projected to fall in every major region in 2026.
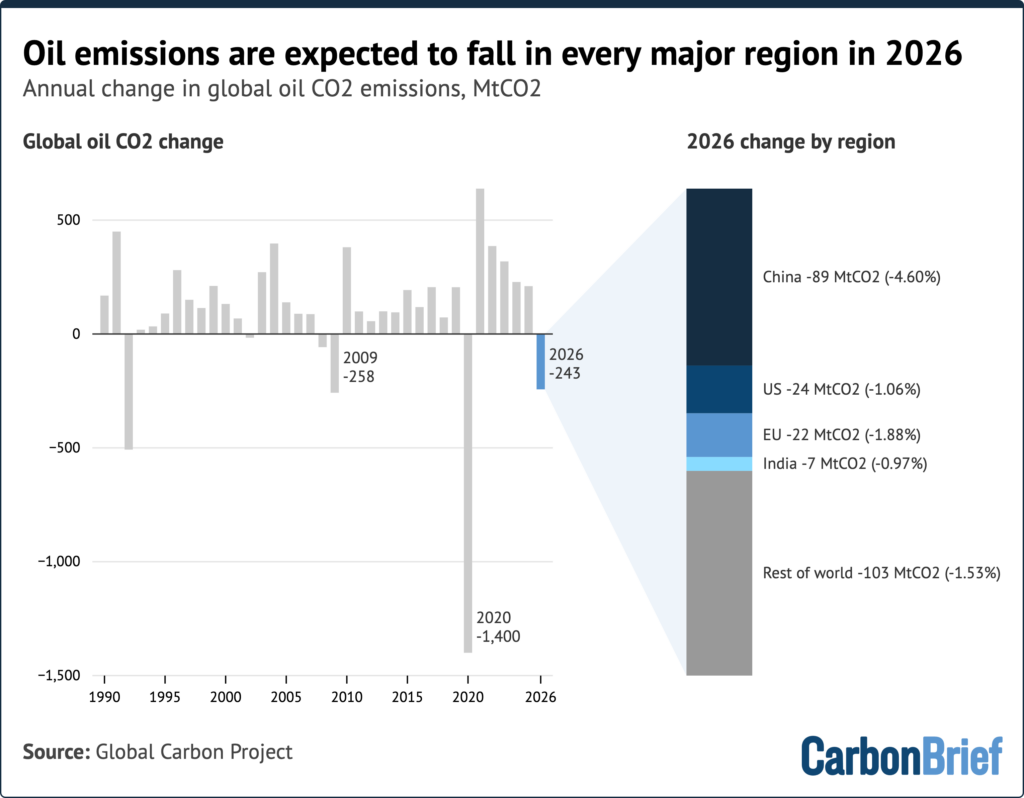
The global carbon budget links most of the oil decline to higher prices and reductions in output after the Iran conflict resulted in the closure of the strait of Hormuz.
Petrol and diesel prices in the US, China and EU were 10-50% higher than in 2025, depending on the fuel and the period.
A study published in parallel by the team behind the global carbon budget reveals that growth in EVs accounted for around a fifth of the overall drop in oil emissions in 2026.
This is consistent with Carbon Brief analysis published in September that estimated that global fossil-fuel emissions were set to fall in 2026 amid the Hormuz crisis.
By contrast, coal emissions are projected to rise by 0.6% (-0.6% to +1.7%), with a strong increase in emissions in India partly offset by sharp falls in the EU and US.
Gas emissions, meanwhile, are projected to fall by 0.3% (-1.6% to +0.9%) – making them effectively flat.
The figure below shows global emissions by fuel since 1959.
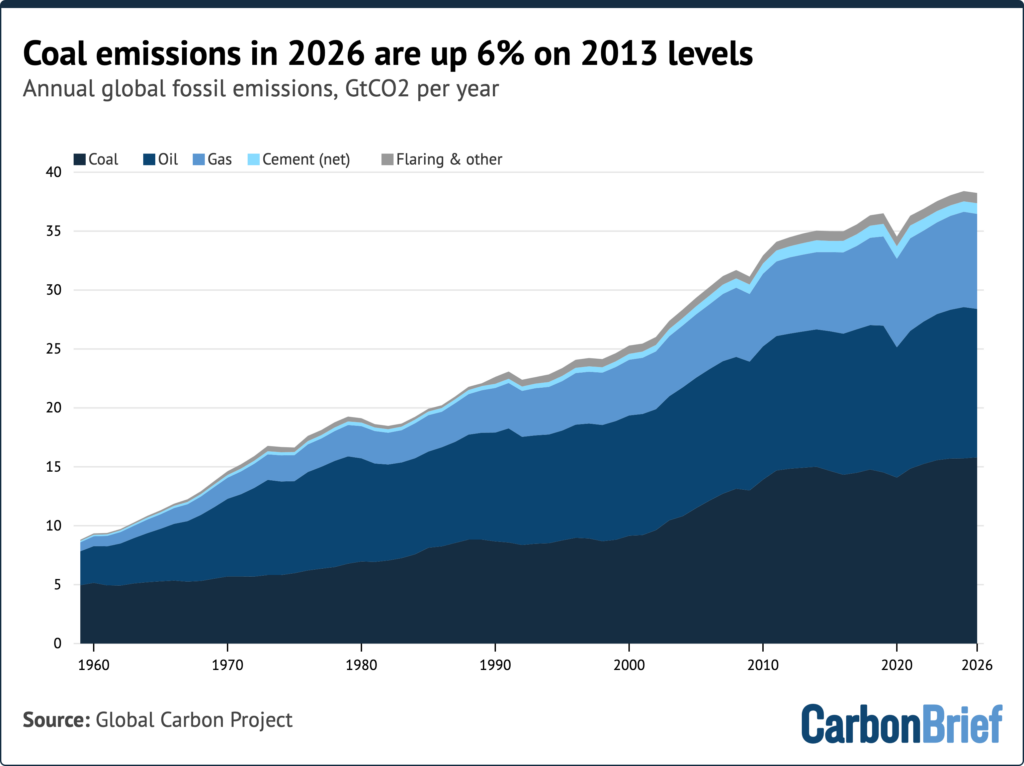
Coal emissions grew rapidly in the 2000s, at around 4% per year, but have risen only slightly since 2013. Even with continued growth, 2026 coal emissions are only around 6% above their 2013 level.
Oil emissions remain about 1% above their pre-pandemic level in 2019.
The figure below shows the contribution of each fuel to the change in global emissions between 2023 and 2026.
§ Land sink in 2025 is highest on record
The annual global carbon budget report tracks both the sources of CO2, from fossil fuels and land use, as well as the “sinks” that take it up: the ocean, the land and the atmosphere.
Over 2016-25, the ocean took up around 27% of total emissions, or 11.1GtCO2 per year, whereas the land around 22%, or 9.2GtCO2 per year. The remaining 48% accumulated in the atmosphere.
The figure below shows the sources of emissions (above zero) and where they end up (below zero) each year. The sum of the sinks is shown as a dashed line for comparison with total emissions.
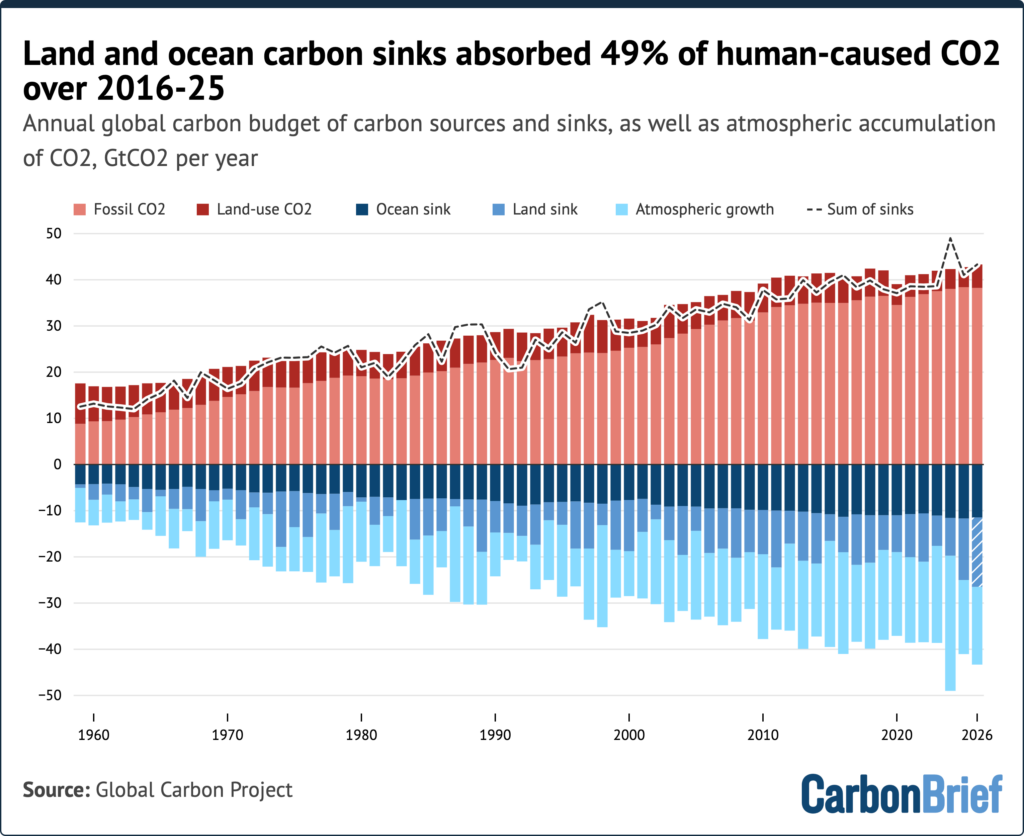
The Global Carbon Project estimates that the land sink in 2025 was the highest on record, at around 13.3GtCO2 – 50% larger than in 2024.
This reflects a strong recovery in the tropics after the 2023-24 El Niño had suppressed the land sink, along with gradual growth of the sink associated with higher atmospheric CO2 concentrations.
The carbon budget does not always balance. In 2024, the estimated sinks exceeded the estimated sources by 6.7GtCO2, the largest “imbalance” on record. This partly offset an imbalance in the opposite direction in 2023 of 3.3GtCO2.
The report attributes much of the 2023-24 discrepancy to the timing of the atmospheric CO2 growth rate. The changes to the land carbon sink in the tropics driven by the El Niño of that year occurred late in the calendar year, so they straddle the 1 January boundary used to calculate annual growth.
A strong El Niño began in June 2026, but its effects on the carbon cycle are not yet visible, as changes in the carbon cycle lag several months behind changes in the climate. Consequently, the global carbon budget researchers expect the effect of the current El Niño to show up predominantly in 2027.
While natural sinks continue to absorb around half of human emissions, climate change is weakening them. The report estimates that the land and ocean sinks were 19% and 8% smaller, respectively, over 2016-25 than they would have been without the effects of climate change and natural fluctuations to the Earth’s climate.
Atmospheric CO2 is projected to rise by 2.2ppm in 2026, similar to the 2.1ppm rise in 2025 and well below the record 3.8ppm rise in 2024 during the last El Niño. CO2 concentrations are set to average 427.7ppm in 2026, roughly 54% above pre-industrial levels.
§ Clean energy is offsetting most emissions from rising energy demand
With global fossil emissions projected to fall in 2026, a natural follow-up question is whether they have now peaked.
The Nature Climate Change research suggests that the answer is not yet.
In the study, the researchers estimate the emissions “avoided” by solar and wind power and EVs, assuming that in their absence the same energy services would have been supplied by fossil fuels.
They then compare these “avoided emissions” with the emissions growth expected from rising economic activity and trends in the carbon intensity of the economy. The latter are described as “demand-driven emissions”.
This is illustrated in the figure below, which shows how increasing demand-driven emissions – which overwhelmingly come from rising energy demand – would have added around 0.78GtCO2 in 2026. However, growth in solar, wind and EVs offset 0.54GtCO2 – or about 69% – of this.
The rest of the decline in global fossil fuel emissions between 2025 and 2026 is attributed by the researchers mostly to high energy prices and supply constraints.
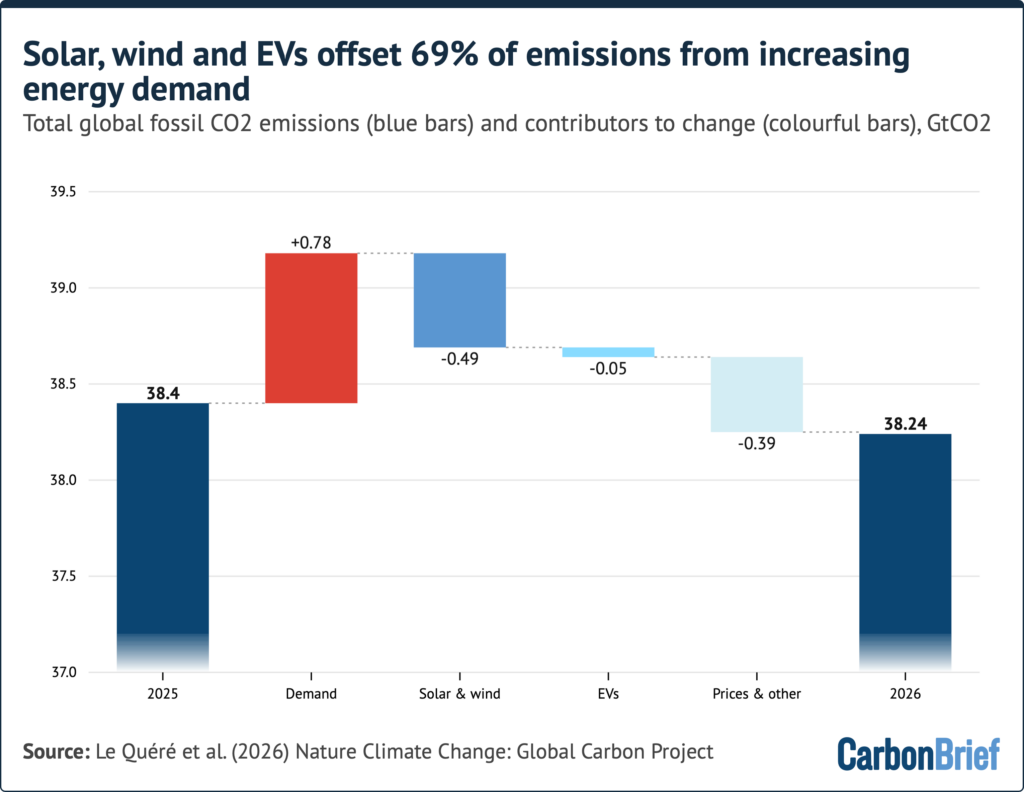
In other words, clean energy alone was not enough to cut emissions in 2026. The researchers’ central estimate suggests global emissions would have continued to rise had it not been for the energy shock from the Iran war.
The scale of avoided emissions is nonetheless large and growing quickly. The authors estimate that solar and wind avoided around 4.1GtCO2 in 2025 and project that they could avoid 4.6GtCO2 in 2026, up from 0.28GtCO2 in 2010. China accounts for around half of this.
Most of these avoided emissions are attributable to solar and wind. EVs avoided 0.19GtCO2 in 2025. The existing vehicle stock takes time to turn over. Currently, just 10% of the global car fleet has been electrified – a figure that drops to 6% if non-plug-in hybrid cars are excluded.
Without solar, wind and EVs, the study estimates that global fossil emissions would have grown by around 1.9% per year over 2019-25 – more than double the actual rate of 0.8% per year.
It also finds that the growth in data centres, driven largely by AI, added around 0.03GtCO2 in 2025, or about 2% of the “demand-driven” increase.
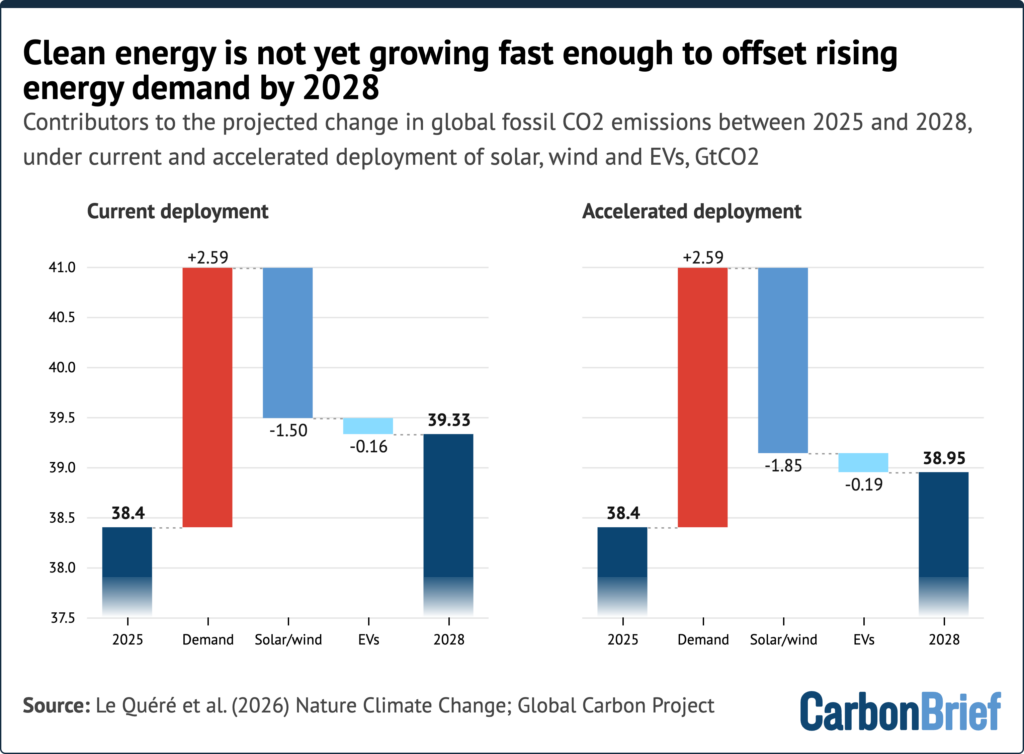
Looking ahead, the researchers explore how EV, solar, and wind might affect emissions in 2028 under two scenarios.
In the first, EV sales and solar and wind additions stay at 2026 levels. In the second, they continue to accelerate along recent trends.
As the figure below shows, rising demand for energy would add around 2.6GtCO2 between 2025 and 2028.
Clean technologies offset 63% of this in the current deployment scenario and 79% in the accelerated scenario. In both cases, overall emissions would still be higher in 2028 than in 2025.
There are important caveats to this approach. The authors note that the avoided-emissions method is a simplified counterfactual approach. It assumes that each unit of clean energy displaces fossil fuels one-for-one without incorporating potential rebound effects, such as the impact of falling clean energy costs on energy demand and fossil fuel costs.
The researchers conclude that the 2026 decline is “not a sign that emissions have peaked from the transition to cleaner energy”, but more likely a short-term response to higher oil prices.
However, the authors add that “if further acceleration of clean technology deployment can be supported through time, a sustained peak and decline in global CO2 emissions could be a few years away”.
Even then, a peak is only a first step. Limiting warming to well below 2C – let alone 1.5C, with a remaining budget of just three and a half years of current emissions – requires emissions to fall rapidly towards net-zero, not just stop rising.
article information
Friedlingstein, P. et al. (2026) Global Carbon Budget 2026, Earth System Science Data, essd-2026-895.
Le Quéré, C. et al. (2026) A further acceleration of clean energy is needed for global CO2 emissions to peak and decline, Nature Climate Change, doi:10.1038/s41558-026-02821-8.


